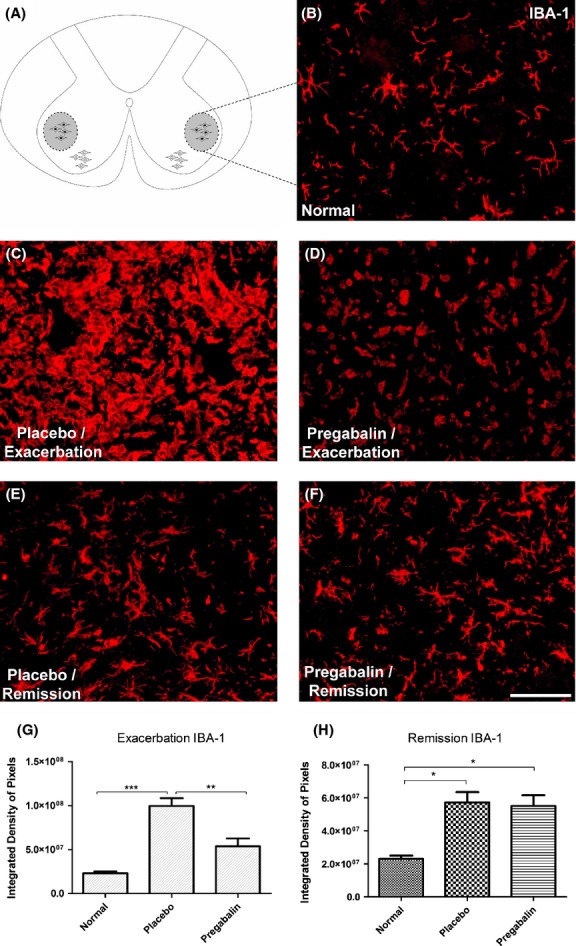
Figure 4.

(A) Diagram showing the region of lamina IX where the motoneurons are present. (B) Normal IBA-1 labeling. (C) Increase of IBA-1 immunoreactivity in the placebo group, especially in the neuropil adjacent to motoneurons, during peak disease. (D) Amelioration of the microglial reaction and decrease of monocyte influx following pregabalin treatment. (E and F) Anti-IBA-1 labeling at the remission phase. Note that there is no difference between placebo- and pregabalin-treated groups. (G) Quantification of the immunolabeling in the different experimental groups during peak disease. (H) Quantification of the immunolabeling in the different experimental groups during remission phase. *P < 0.05, **P < 0.01, ***P < 0.001. N = 6 for each experimental group. Scale bar 50 μm.
