Figure 6.

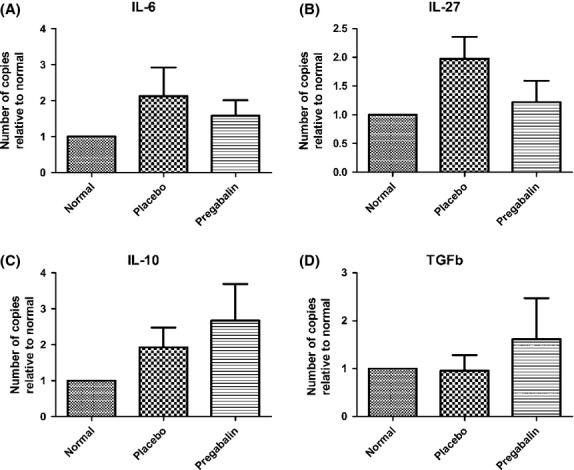
Quantification of the gene transcript levels for IL-6 (A), IL-27 (B), IL-10 (C) and TGFb (D). No statistical differences could be seen among the experimental groups. N = 6 for each experimental group.

Quantification of the gene transcript levels for IL-6 (A), IL-27 (B), IL-10 (C) and TGFb (D). No statistical differences could be seen among the experimental groups. N = 6 for each experimental group.