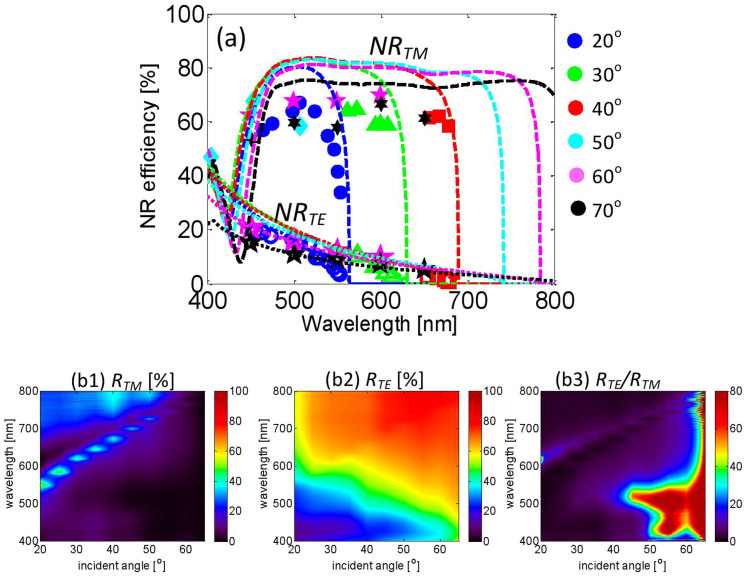
Figure 2. NR and reflection spectra.
(a) NR spectra for incident angles from 20° to 70°. The different colors denote different incident angles. The solid and hollow markers indicate measured results for TM and TE light, respectively. The dashed and dotted lines correspond to simulated results for TM and TE light, respectively, which are selected from Fig. 3(a1–a2). (b1–b3) Measured reflection spectra of (b1) TM light and (b2) TE light and (b3) the corresponding extinction ratios of RTE/RTM. The colors in (b1) and (b2) are the fraction of incident power going into NR or R in percentage. These results show that NRTM is much larger than NRTE, while RTE is larger than RTM. The operational spectrum expands to the entire visible light range for an incident angle of 70°. The TM reflection exhibits a single peak arising from SPR at the interface of Al and air.

