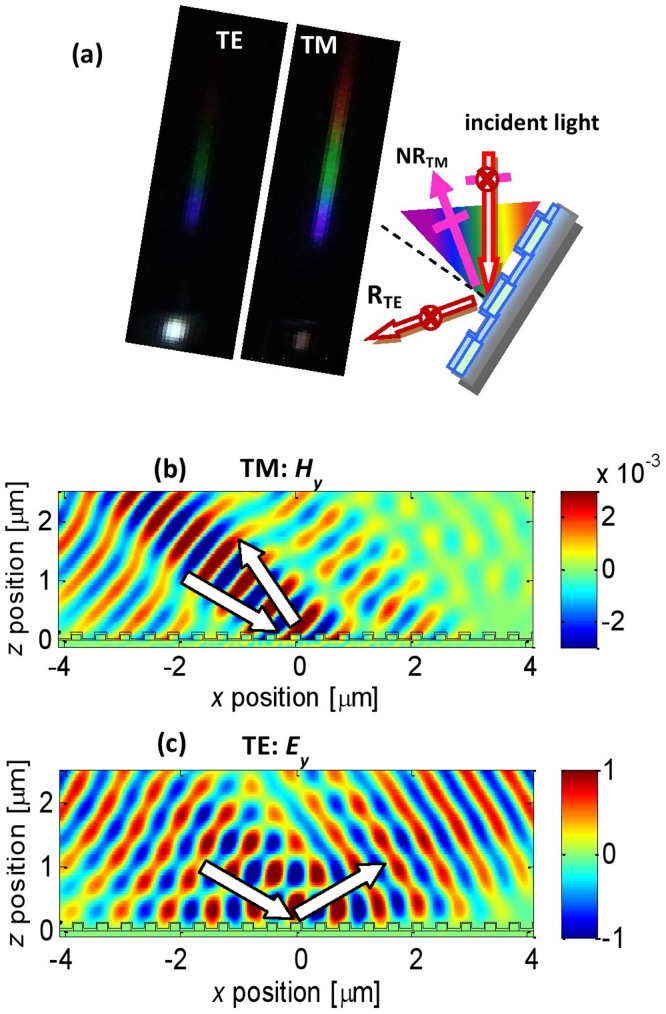
Figure 4. Far- and near-field distributions.
(a) Images of NR and reflection for TE and TM white light, respectively, for an incident angle of 55° in the experiment. The TM light is strongly negatively reflected as a rainbow of colors while the TE light is primarily reflected as white light. Panels (b) and (c) display the time snapshots of the simulated magnetic field Hy for TM light and the electric field Ey for TE light, respectively, for a wavelength of 500 nm and an incident angle of 55°. The incident, NR, and reflected light are depicted by the white arrows, respectively. The black lines schematically depict the profile of the bilayer grating. The structure used in the simulation is the same as that of the fabricated device shown in Fig. 1. The magnitude of the incident electric field is 1.0.

