
Figure 1.
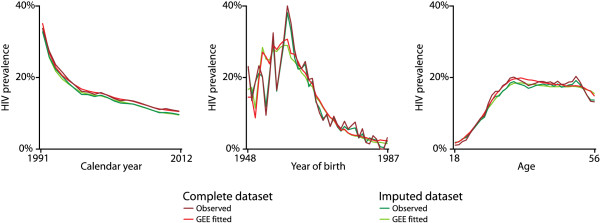
HIV prevalence using all data from the complete and the imputed long dataset. One record per patient for each year being in treatment. Plotted by calendar year, year of birth, or age, respectively.
Official websites use .gov
A
.gov website belongs to an official
government organization in the United States.
Secure .gov websites use HTTPS
A lock (
) or https:// means you've safely
connected to the .gov website. Share sensitive
information only on official, secure websites.
HIV prevalence using all data from the complete and the imputed long dataset. One record per patient for each year being in treatment. Plotted by calendar year, year of birth, or age, respectively.