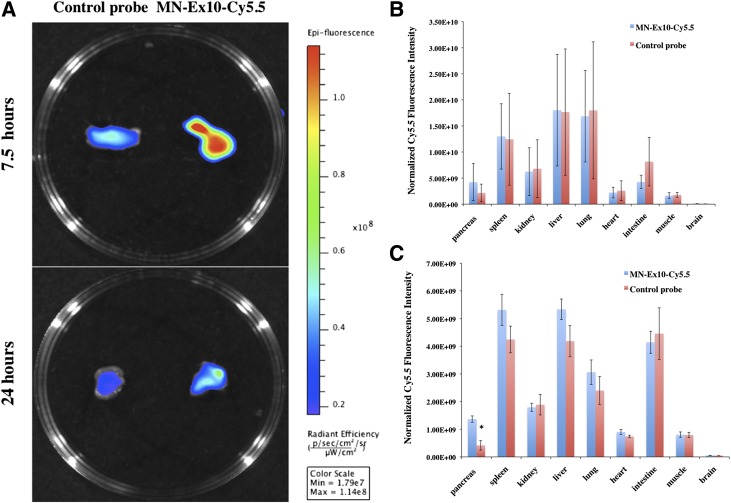
Figure 2.
A: Ex vivo fluorescence imaging of murine pancreas at 7.5 and 24 h after an intravenous injection of MN-Ex10-Cy5.5 or control MN-Cy5.5 probes (10 mg Fe/kg). Note the higher accumulation of MN-Ex10-Cy5.5 in the pancreata of experimental animals compared with controls at both times after injection. sec, seconds. B: Ex vivo quantification of normalized Cy5.5 fluorescence 7.5 h after the intravenous injection of MN-Ex10-Cy5.5 and MN-Cy5.5 probes. C: Ex vivo quantification of normalized Cy5.5 fluorescence 24 h after the intravenous injection of MN-Ex10-Cy5.5 and MN-Cy5.5 probes. *P < 0.05 indicates significant difference between fluorescence intensities of pancreatic tissues of the animals injected with MN-Ex10-Cy5.5 or control probes.

