Table 3.
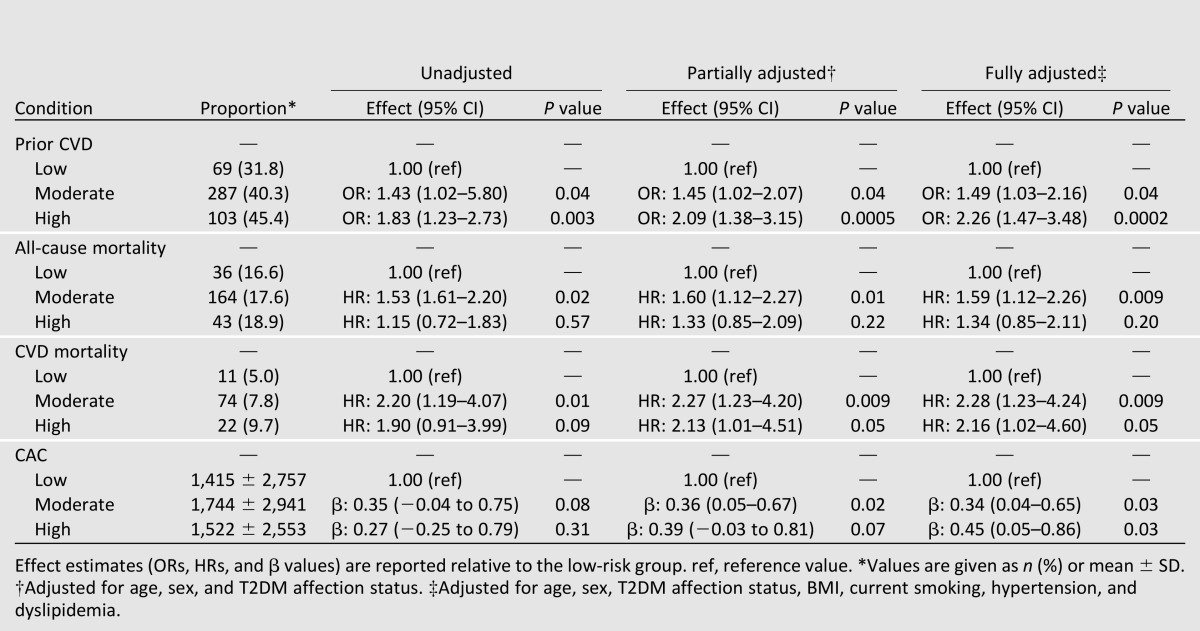
Association between weighted GRS13 low (n = 217), moderate (n = 713), and high (n = 227) groups and history of CVD, all-cause mortality, CVD mortality, and CAC in EAs from the DHS

Association between weighted GRS13 low (n = 217), moderate (n = 713), and high (n = 227) groups and history of CVD, all-cause mortality, CVD mortality, and CAC in EAs from the DHS
