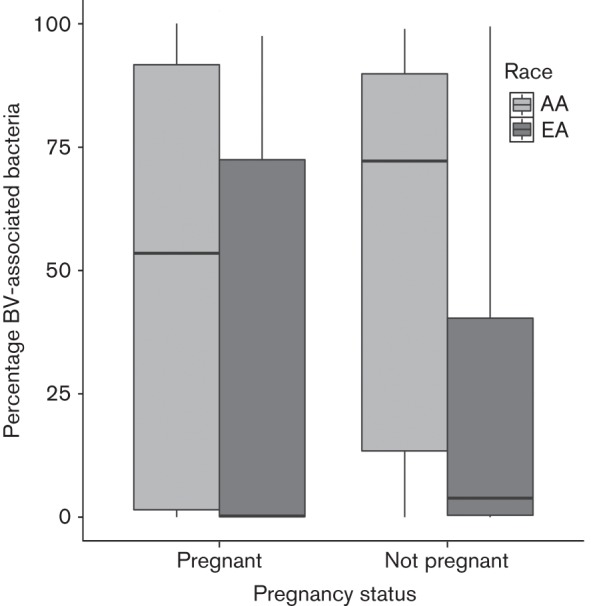
Fig. 5.

Relationship between the percentage of BV-associated bacteria and pregnancy and ethnicity. The analysis includes healthy women and women with BV. Subjects were grouped based on self-reported pregnancy status. Within each group, the proportion of BV-associated bacteria was plotted for women of African ancestry (AA) and women of European ancestry (EA). The boxes indicate the interquartile range, and the horizontal line in each box indicates the median. The plot reflects data from 418 women.
