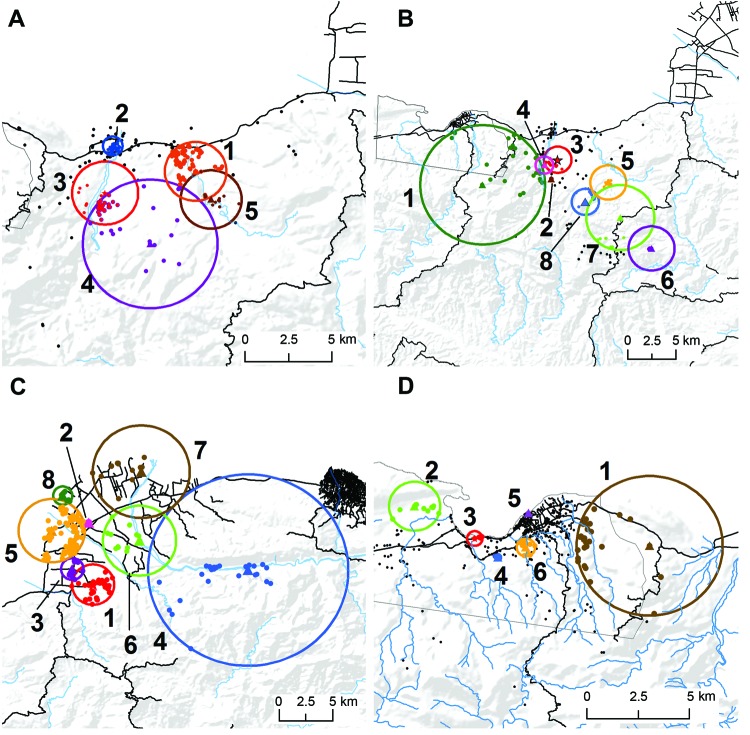
Figure 2.
Space-time clusters of cholera in 4 communities in Haiti, 2011. A) Grand Goave, winter; B) Grand Goave, summer; C) Leogane, summer; and D) Petit Goave, summer. Stars represent primary cluster centers and triangles, secondary cluster centers. Dots represent approximate locations of households within clusters. Clusters are numbered sequentially by order of date of occurrence.

