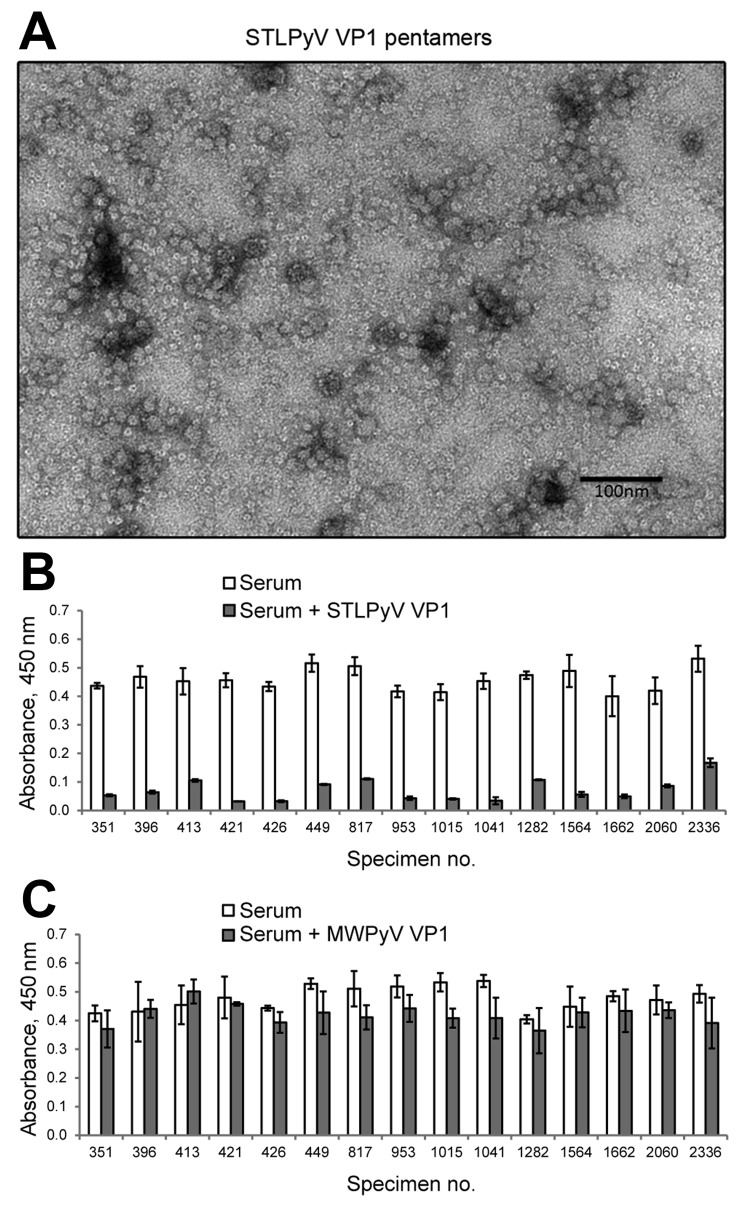
Figure 1.
STL polyomavirus (STLPyV) ELISA. A) Electron microscopy image shows purified STLPyV VP1 capsomeres. Scale bar = 100 nm. B) Serum samples were pre-incubated in the absence (white bars) or presence of soluble STLPyV VP1 pentamers (gray bars), followed by the STLPyV-capture ELISA. Serum was tested in triplicate, and average absorbance values are shown. Error bars indicate SD. Representative data are shown. C) Seroreactivity to STLPyV in the absence (white bars) or presence of competition with MW polyomavirus (MWPyV) VP1 pentamers (gray bars) are shown. Serum was tested in triplicate, and average absorbance values are shown. Error bars indicate SD. Representative data are shown.

