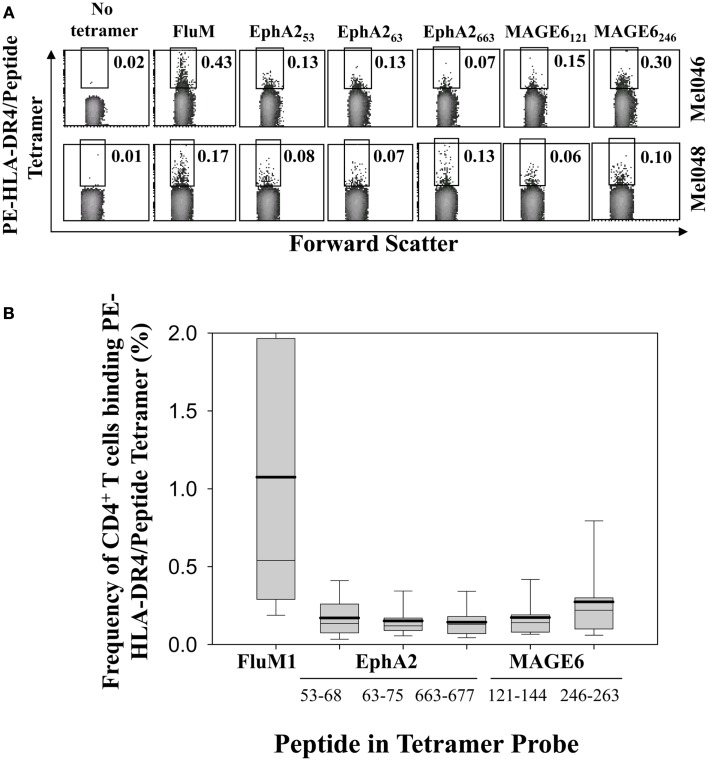
Figure 1.
Flow cytometric analysis of antigen-specific CD4+ T cells isolated from melanoma patients. (A) Representative plots of flow cytometry analysis of HLA-DR*0401/peptide tetramer+CD4+ T cells from two melanoma patients (Mel046, Mel048). Live cells were gated based on forward and side scatter. Regions used to enumerate frequencies of (FluM1 or individual EphA2 or MAGE6 TAA) tetramer-reactive CD4+ T cells are shown. (B) Composite data obtained from flow cytometry analysis of CD4+ T cells using the indicated PE-labeled HLA-DR4/peptide tetramer probes in 15 HLA-DR*0401+ melanoma patients (Table 1; Mel031-Mel104). Box plots represent the range of responses for all patients, with mean frequencies shown as solid horizontal lines, and with whisker bars representing 5th and 95th percentiles for each HLA-DR4/peptide tetramer analyzed.

