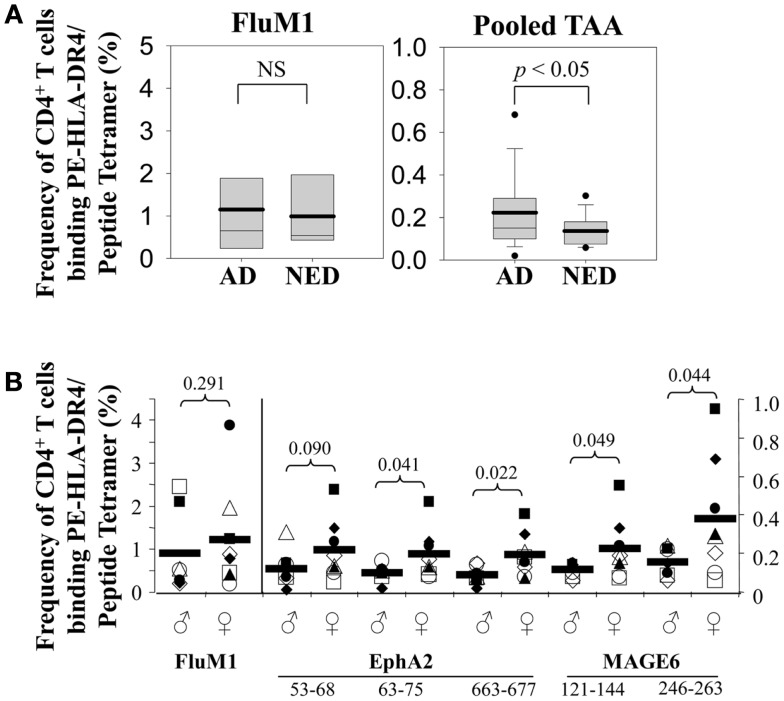
Figure 2.
Frequency of MAGE-6-, EphA2-, and Flu-specific CD4+ T cells in melanoma patients varies based on disease status and gender. (A) Frequencies of antigen-specific CD4+ T cells in patients with active disease (AD; n = 8) vs. no evidence of disease (NED; n = 7) were determined using PE-labeled HLA-DR4/peptide tetramers and flow cytometry as described in Figure 1 and Section “Materials and Methods.” Composite data are depicted in Box plots. The means are represented as solid horizontal lines, whisker bars representing 5th and 95th percentiles, and outliers are represented by dots. Left graph represents FluM1-specific CD4+ T cells and the right graph represents pooled (three EphA2 epitopes + two MAGE6 epitopes) TAA-specific responses. (B) Frequencies of antigen-specific CD4+ T cells from seven male and eight female patients (no difference in age, disease stage, or presence/absence of disease) were determined using PE-labeled HLA-DR4/peptide tetramers and flow cytometry as indicated in Figure 1 and Section “Materials and Methods.” Symbols indicate data for individual patients, with mean frequencies indicated by heavy horizontal bars. T-test analysis was used to compare male vs. female patients, with p-values of differences between male/female cohorts indicated.

