Figure 2.
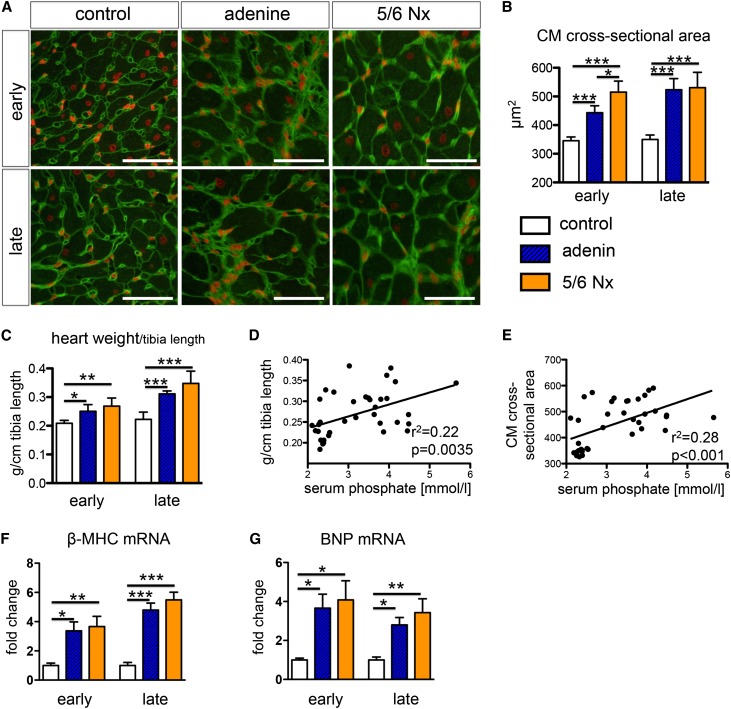
The severity of cardiac hypertrophy correlates with serum phosphate levels. (A and B) Wheat germ agglutinin (WGA) staining (A) and quantification of cardiomyocyte cross-sectional area (B) indicates hypertrophy of cardiomyocytes in both models of UC: early (i.e., 4–6 weeks after induction of CKD) and late (8–10 weeks after induction of CKD). (C) Significantly increased heart weight in both models of UC at early and late time points. (D and E) Parameters of left ventricular hypertrophy show a significant linear regression with serum phosphate levels. (F and G) Quantitative real-time PCR analysis revealed significant cardiac upregulation of β-myosin heavy chain (MHC) (D) and brain natriuretic peptide (BNP) in both models of UC. *P<0.05; **P<0.01; ***P<0.001 (one-way ANOVA with post hoc Scheffe test). All scale bars=50 μm.

