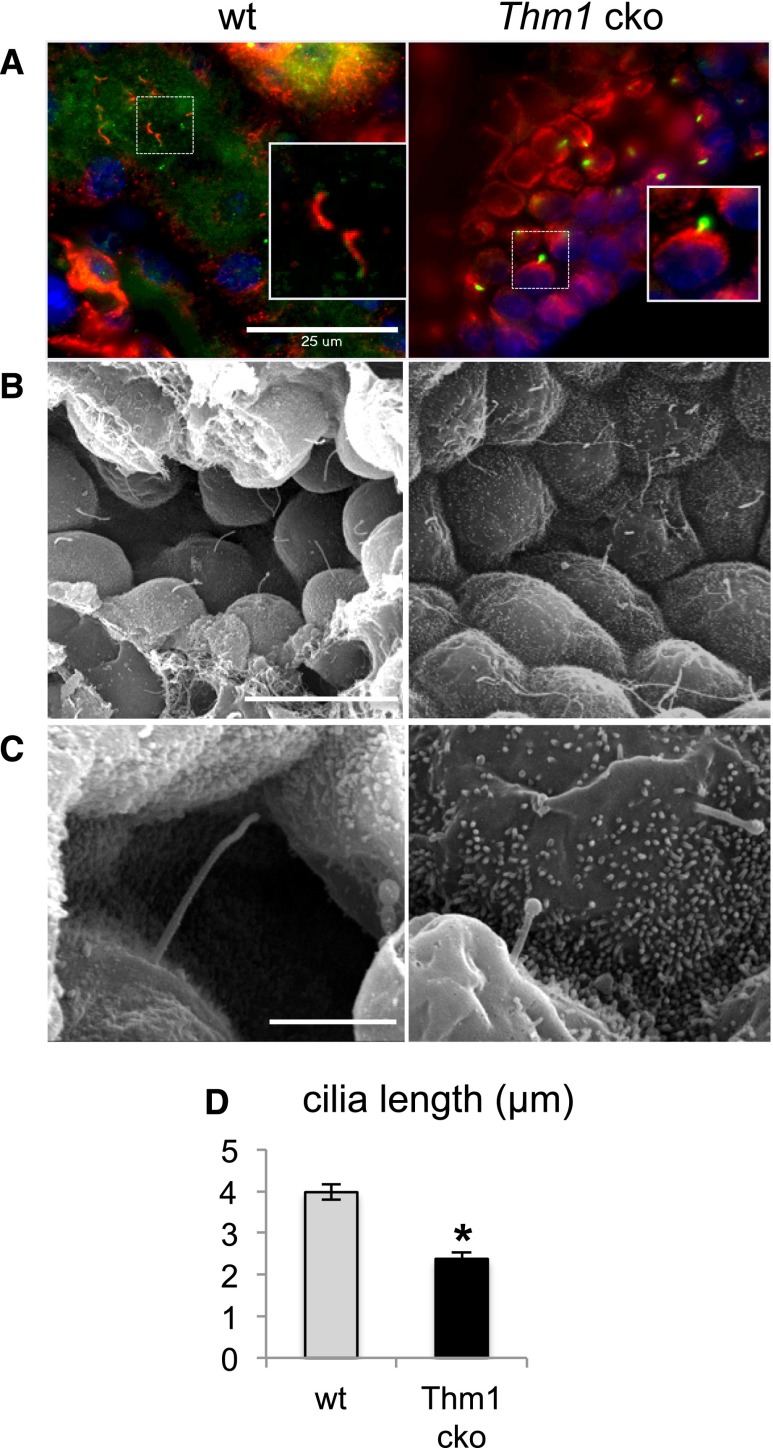
Figure 3.
Thm1 cko renal primary cilia show IFT complex A mutant phenotype. (A) Immunostaining of wt and Thm1 cko renal primary cilia for acetylated α-tubulin (red) and IFT88 (green). Scale bar represents 25 μm. (B) Scanning electron micrographs of wt and Thm1 cko collecting ducts (original magnification, ×2000). Scale bar represents 15 μm. (C) Scanning electron micrographs of wt and Thm1 cko collecting duct primary cilia (original magnification, ×15,000). Scale bar represents 3 μm. (D) Lengths of wt and Thm1 cko collecting duct primary cilia. Bars represent mean±SEM of n=23 cilia from three wt mice and n=25 cilia from two Thm1 cko mice. *P<5×10⁻⁸.

