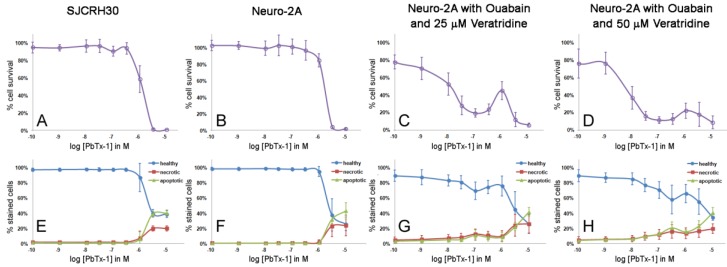
Figure 3.
Cytotoxicity and apoptosis assay curves of cells treated with PbTx-1 for 48 h. (A–D) (purple open circle) the cytotoxicity assay as measured by fluorescent nuclear stain. (E–H) The apoptosis assay for apoptosis as measured by Annexin V staining (green triangle), necrosis as measured by Annexin V/PI co-staining (red square) and healthy cells as measured by no staining (blue circle). Each point represents the mean ± standard deviation for n = 3–5 experiments.

