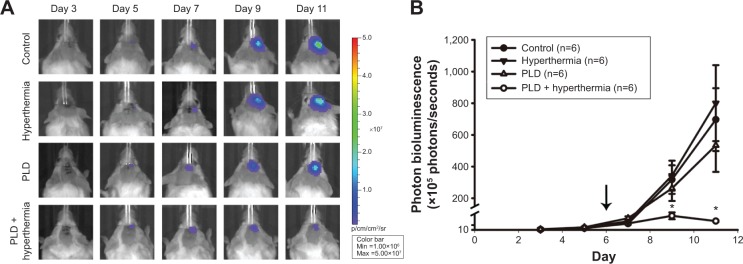
Figure 4.

IVIS imaging of mouse brain tumors from day 3 to day 11 after tumor implantation.
Notes: (A) Mice with luciferase-expressing 4T1-luc2 breast cancer cells implanted in their striatum tissue. There were four groups: control (no treatment), hyperthermia, PLD, and PLD + hyperthermia. Treatment was executed on day 6 after tumor implantation, and images were obtained every other day. (B) Bioluminescent signals were quantified using the IVIS imaging system. The arrow indicates when the different treatments were performed. Note that PLD + hyperthermia markedly inhibited breast tumor growth in the brain. Data are presented as the mean ± SEM (n=6 for each group). *P<0.05 compared with the control group.
Abbreviations: PLD, pegylated liposomal doxorubicin; SEM, standard error of the mean.
