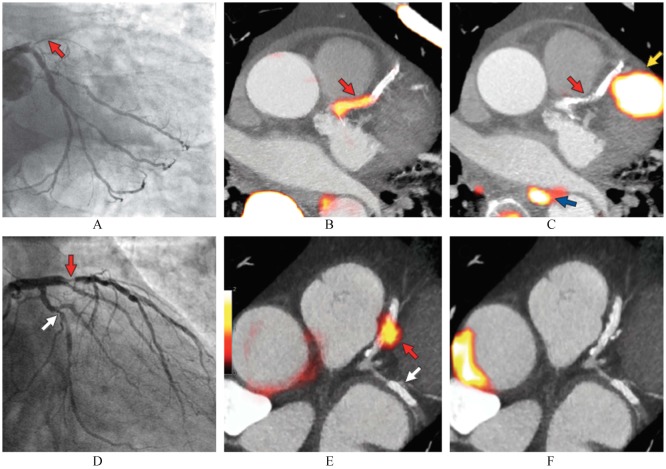
Figure 4. Focal 18F-fluoride and 18F-fluorodeoxyglucose uptake in patients with myocardial infarction and stable angina.
Patient with acute ST-segment elevation myocardial infarction with (A): proximal occlusion (red arrow) of the left anterior descending artery on invasive coronary angiography and (B): intense focal 18F-fluoride [18F-NaF, tissue-to-background ratios, culprit 2.27 vs. reference segment 1.09 (108% increase)] uptake (yellow-red) at the site of the culprit plaque (red arrow) on the combined positron emission and computed tomogram (PET-CT). (C): Corresponding 18F-fluorodeoxyglucose PET-CT image showing no uptake at the site of the culprit plaque (18F-FDG, tissue-to-background ratios, 1.63 versus reference segment 1.91 (15% decrease)). Note the significant myocardial uptake overlapping with the coronary artery (yellow arrow) and uptake within the oesophagus (blue arrow). (D): Patient with anterior non-ST-segment elevation myocardial infarction with culprit (red arrow; left anterior descending artery) and bystander non-culprit (white arrow; circumflex artery) lesions on invasive coronary angiography that were both stented during the index admission. (E): Only the culprit lesion had increased 18F-NaF uptake [18F-NaF, tissue-to-background ratios, culprit 2.03 vs. reference segment 1.08 (88% increase)] on PET-CT after percutaneous coronary intervention. Corresponding 18F-fluorodeoxyglucose (18F-FDG), PET-CT showing no uptake either at the culprit [18F-FDG, tissue-to-background ratios, culprit 1.62 vs. reference segment 1.49 (9% increase)] or the bystander stented lesion. Note intense uptake within the ascending aorta (F). Reprint with permission from reference [88].

