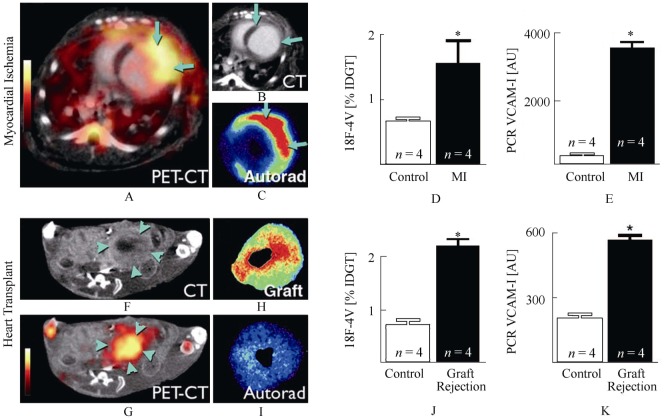
Figure 5. 18F-4V imaging in myocardial infarction and transplant rejection.
(A): PET-CT shows strong signal in the infarcted left ventricular wall. (B): Infarcted myocardium shows delayed CT hyperenhancement after iodine (arrows). (C): Autoradiography of myocardial ring. (D): %IDGT in the infarct. (E): VCAM-1 mRNA in infarct tissue. (F, G): PET-CT of a heart transplanted heterotopically into the abdominal cavity. The rejected allograft (arrowheads) shows high uptake of 18F-4V. (H, I): Autoradiography of graft and orthotopic recipient heart. (J): Uptake of 18F-4V in rejected allografts. (K): VCAM-1 mRNA levels in control heart tissue and rejected cardiac allografts. *P < 0.05. IDGT: injected dose/gram tissue; MI: myocardial infarction; VCAM: vascular cell adhesion muscle. Reprint with permission from reference [89].

