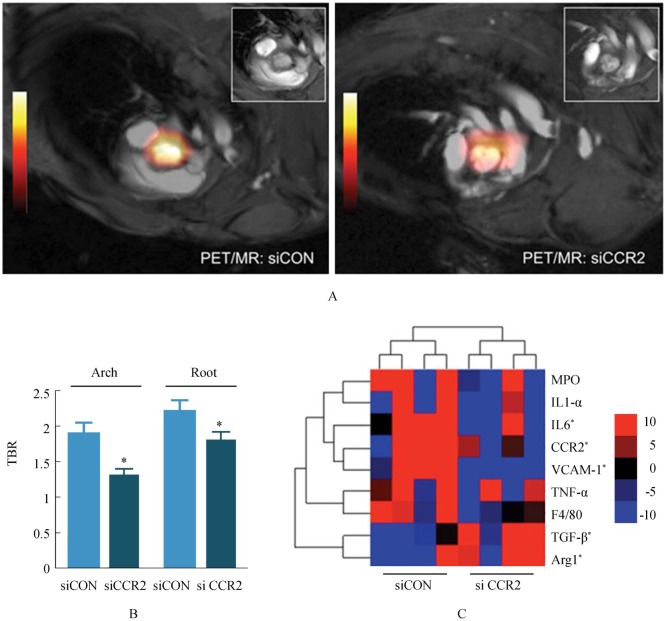
Figure 6. Positron emission tomography/magnetic resonance image (PET/MRI) and gene expression analysis of siRNA treated ApoE−/− mice.
(A): Representative PET/MRI of control siRNA (siCON) and siCCR2-treated ApoE−/− mice. Inset: MRI frame at the level of the aortic valve. (B): PET target-to-background ratio in ApoE−/− mice treated with control siRNA (siCON) vs. siCCR2 (n = 5 per group). Data are presented as mean ± SE, *P < 0.05. (C): Heat map of genes in aortic roots (n = 4 per group). Each row of the heat map represents a gene, whereas each column represents an experimental treatment group (labeled at the bottom). The color scale represents the level of gene expression, with red indicating an increase in gene expression and blue indicating a decrease in gene expression. ApoE: apolipoprotein; Arg1: arginase 1; CCR2: C-C chemokine receptor type 2; IL: interleukin; MPO: myeloperoxidase; PET/MRI: Positron emission tomography/magnetic resonance image; siCON: si control; siRNA: short-interfering RNA; TBR: target-to-background ratio; TGF: transforming growth factor; TNF: tumor necrosis factor; VCAM: vascular cell adhesion molecule 1. Reprint with permission from reference [105].

