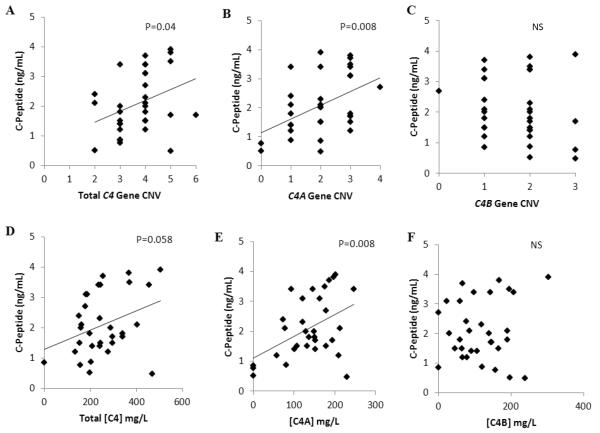
Fig. 2.
Correlation of total C4 gene CNV (A), C4A gene CNV (B), C4B gene CNV (C), total C4 protein (D), C4A protein (E) and C4B protein (F) concentrations with stimulated C-peptide levels at 1-month after disease onset. Note that higher total C4 CNV or C4A gene is positively correlated with C-Peptide levels (p=0.04, p=0.008 respectively), and higher total C4 protein concentration or C4A protein concentration is positively correlated with C-peptide levels (p=0.058, p=0.008 respectively).

