
FIG 2.
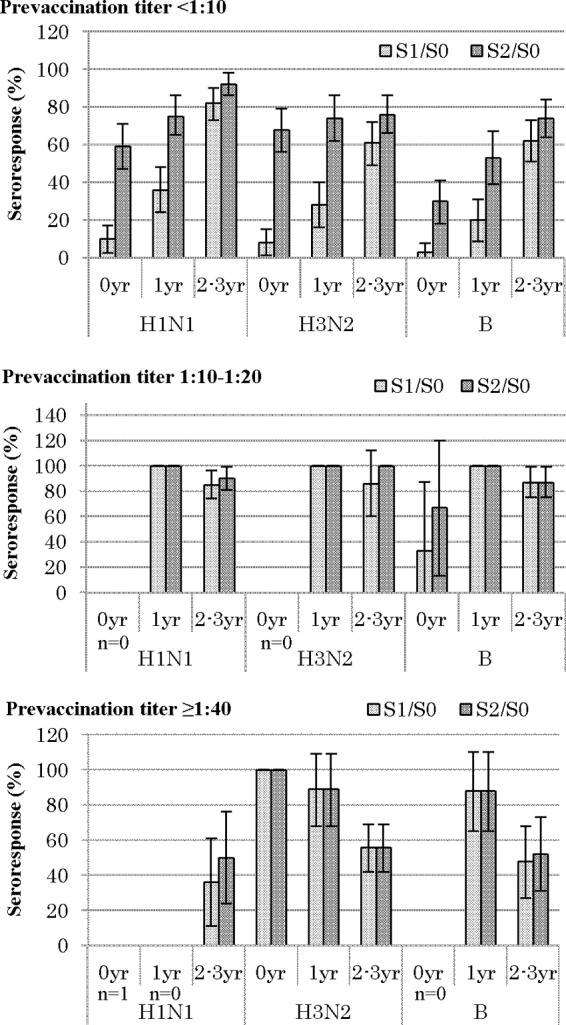
Age-specific seroresponse proportion and 95% CIs stratified by prevaccination titer. S0, before vaccination; S1, after the first dose; S2, after the second dose; n, total no. of subjects.
Official websites use .gov
A
.gov website belongs to an official
government organization in the United States.
Secure .gov websites use HTTPS
A lock (
) or https:// means you've safely
connected to the .gov website. Share sensitive
information only on official, secure websites.
Age-specific seroresponse proportion and 95% CIs stratified by prevaccination titer. S0, before vaccination; S1, after the first dose; S2, after the second dose; n, total no. of subjects.