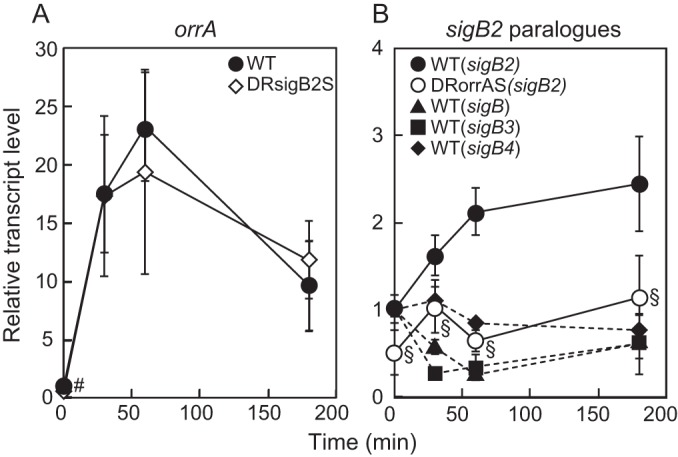
FIG 4.

Changes in the transcript levels of orrA and sigB2 paralogues in response to salt stress. (A) The transcript levels of orrA in the wild-type and DRsigB2S strains after addition of 50 mM NaCl were determined by qRT-PCR. (B) The transcript levels of sigB2 paralogues, sigB, sigB2, sigB3, and sigB4, in the wild type and sigB2 in the DRorrAS strain were determined. The transcript levels were determined in duplicate measurements using three independently grown cultures. The transcript level at 0 min in the wild type was taken as 1. Data that represent a significant difference (P < 0.05; t test) between the wild type and DRorrAS (#) or DRsigB2S (§) are indicated.
