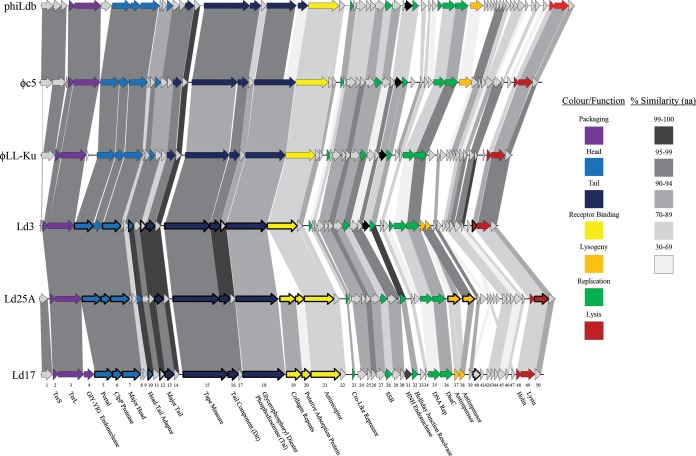
FIG 2.
Genomic organization of Ld3, Ld17, and Ld25A compared to phiLdb, c5, and LL-Ku. The scale at the top of the genomes is in base pairs. Each arrow represents an ORF, with the color representing the putative function of the encoded protein that is indicated in the legend. Percent identities (amino acids) between adjacent genomes are colored as outlined on the right. ORFs confirmed as members of the structural proteome by mass spectrometric analysis are marked as bold arrows. The ORFs of Ld17 are numbered along the bottom of the genome map.

