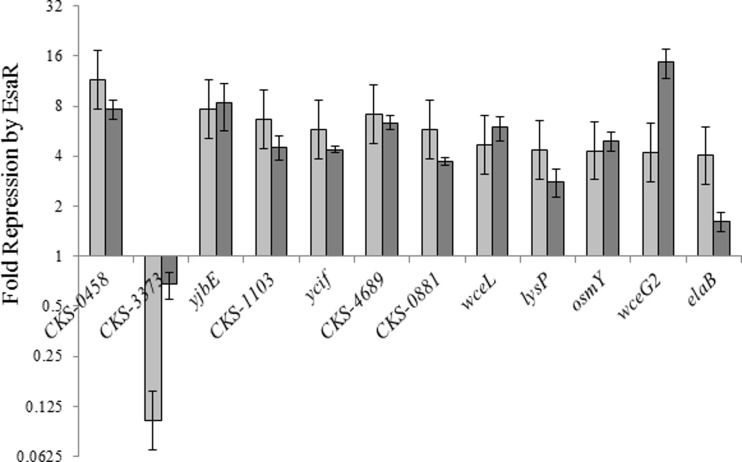
FIG 3.
Validating transcriptional control of putative EsaR direct targets. Changes in gene expression were compared between RNA-Seq analysis (light gray) and qRT-PCR assays (dark gray) of the 12 potential targets of EsaR assayed for direct regulation. The y axis represents the fold repression (>1) or activation (<1) in the presence of EsaR. CKS-3373 is the only gene seen to be activated in the subset. Data represent two experimental samples analyzed in triplicate. Error bars for qRT-PCR values denote standard error. Error bars for RNA-Seq ratios represent an estimate of the standard deviation across all genes in shown in Fig. 1.

