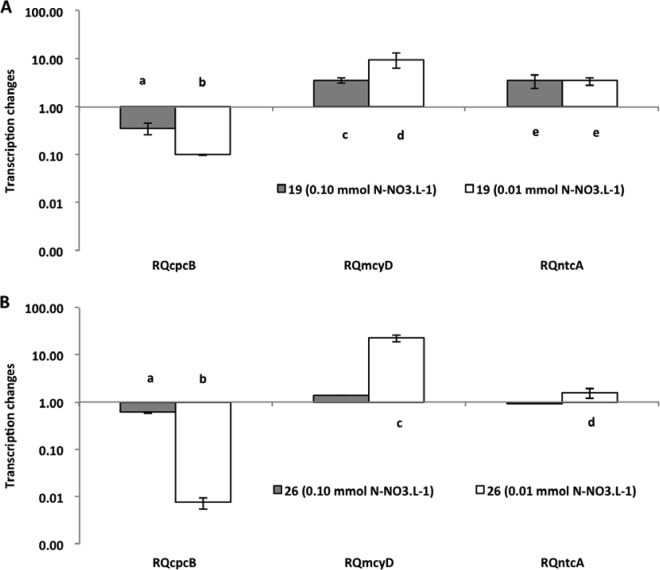
FIG 2.
Relative quantification of cpcB, mcyD, and ntcA gene expression in the nitrate assay for two cyanobacterial strains (19 and 26). The 1 mmol liter−1 concentration was used as a standard (control) to estimate changes in gene expression under limited conditions. Bars indicate standard errors. Different letters above the bars indicate significant differences (P ≤ 0.05), when values were compared to the control and among themselves.

