
FIG 2.
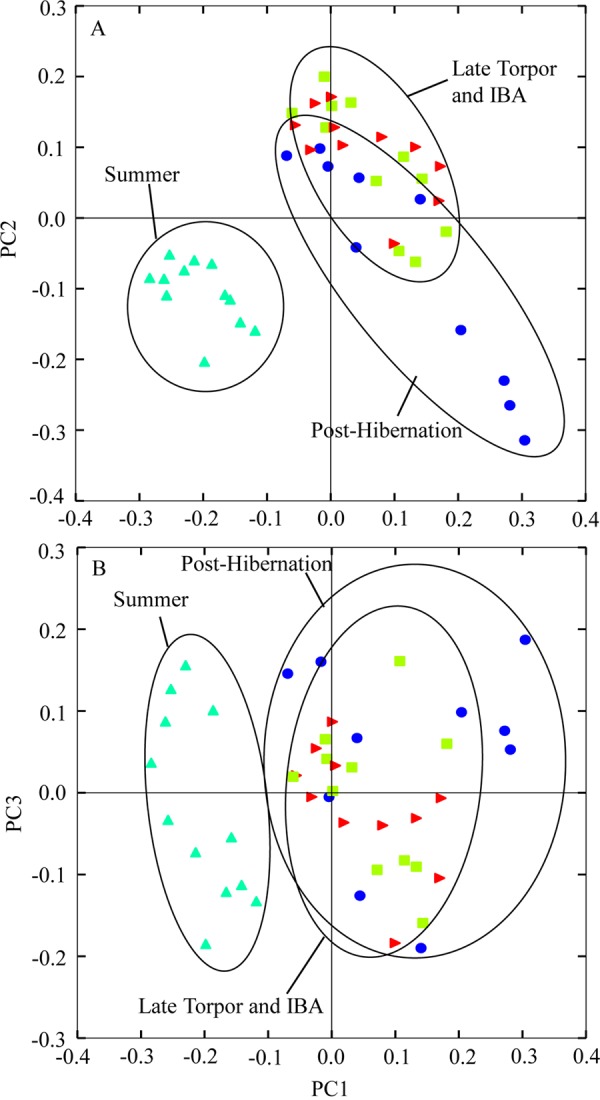
Principal-coordinate analysis plots (PC1 versus PC2 [A] and PC1 versus PC3 [B]), of unweighted UniFrac distance metric of gut microbiotas from 4 sample periods. Each point represents the gut microbial community of an individual arctic ground squirrel at a given sample period.