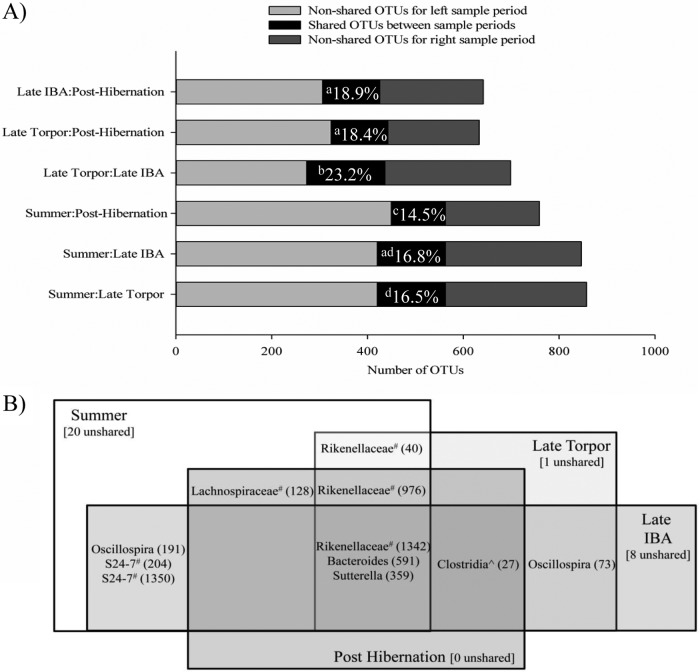
FIG 4.
Shared OTUs among squirrel microbiotas. (A) Pairwise comparisons of shared OTUs between sample periods. The mean percentage of shared OTUs is indicated in each comparison, and significant differences are indicated by different letters (P < 0.05). (B) Venn diagram of taxa represented in 100% of squirrel microbiotas. ^ and #, unclassified order and genus, respectively, within a taxonomic group. Numbers in parentheses are OTU numbers.

