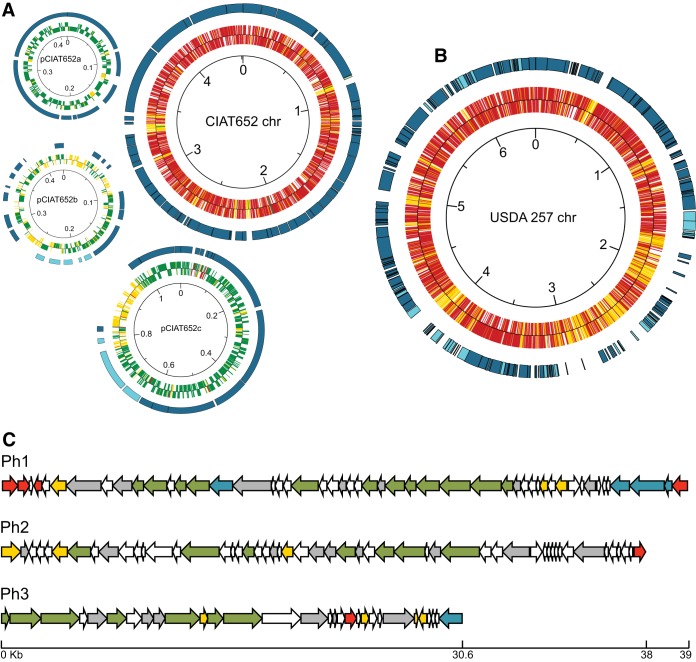
FIG 7.
Schematic representations of the genome and prophages of strain CCGM1 and the genome of strain CCGM7. (A) Assembled genome of strain CCGM1 based on the CIAT652 backbone (chromosome and plasmids). For the chromosome (chr), the inner circle shows the prediction of open reading frames for the plus (upper) and minus (lower) strands of CCGM1 (red, homologs with the CIAT652 chromosome; green, homologs with CIAT652 plasmids; yellow, nonhomologous open reading frames), and the outer circle shows segments of homology with direct orientation (dark blue). For plasmids, the inner circles show open reading frame predictions for CCGM1 (green, homologs with the CIAT652 plasmid pCIAT652a, pCIAT652b, or pCIAT652c; red, homologs with the CIAT652 chromosome; yellow, nonhomologous open reading frames), and the outer circles show segments of homology with direct (dark blue) or inverse (light blue) orientation. The scale is in megabases. (B) Assembled genome of strain CCGM7 based on the USDA257 chromosome. The inner circle shows open reading frame predictions for CCGM7 in the plus (upper) and minus (lower) strands (red, homologs with the USDA257 chromosome; yellow, nonhomologous open reading frames). The outer circle shows segments of homology with direct (dark blue) or inverse (light blue) orientation. The scale is in megabases. Both panels A and B were drawn with GenVision. (C) Structures of predicted CCGM1 prophages. Shown are open reading frame functional predictions for prophage structure (green arrows), lysis (yellow arrows), mobilization (blue arrows), regulation of transposition (red arrows), and other functions (gray arrows), as well as open reading frames with hypothetical functions (white arrows). The scale is in kilobases.

