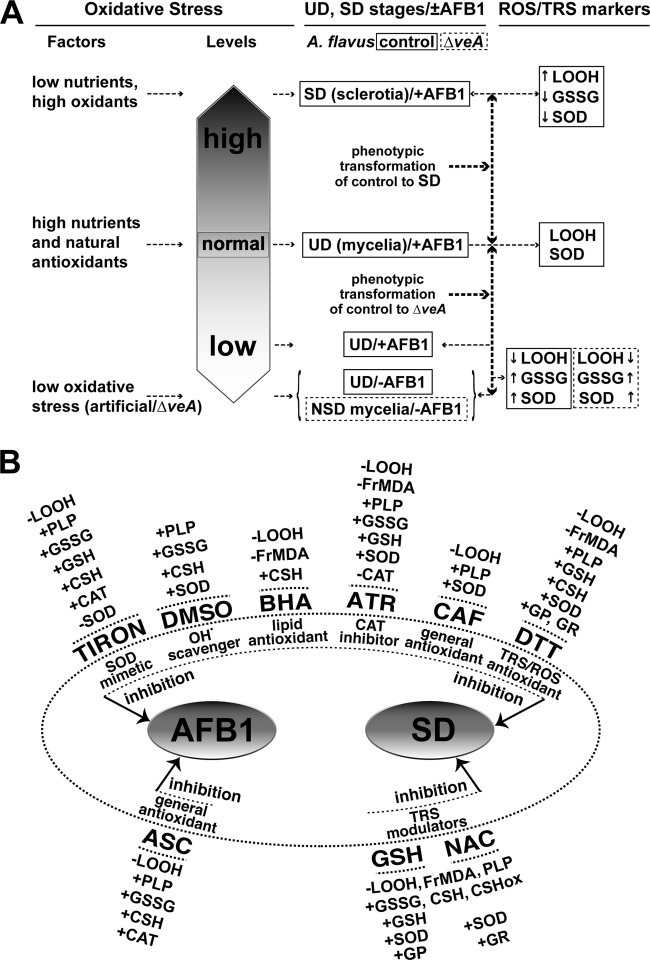
FIG 2.
Aflatoxin B1 (AFB1) yield, sclerotial differentiation (SD), and oxidative stress in A. flavus. (A) Aflatoxin B1 biosynthesis and SD in the control A. flavus and the ΔveA mutant strain are regulated by different oxidative stress levels; an oxidative stress increase or decrease in these strains is designated by open upward or downward arrows, respectively. Oxidative stress levels are assigned as low or high compared to the normal level, defined by the concentrations of the oxidative stress markers LOOH and SOD in the undifferentiated (UD) stage of the control A. flavus (on day 2). The upward and downward arrows designate an increase or decrease in these markers, respectively. (B) Effect of certain oxidative stress modulators on the aflatoxin B1 yield and SD in the control A. flavus, and their correlation with certain oxidative stress markers. A concentration increase and decrease in these markers is designated by the “+” and “−” signs, respectively (the actual concentration values are given in Tables 2 to 4). Abbreviations: TIRON, DMSO, ATR, GSH, NAC, DTT, CAF, BHA, and ASC are as described in the legend of Fig. 1 and as defined in Materials and Methods, as are LOOH (lipid hydroperoxides), FrMDA, and PLP (polyphenols), GSSG, SOD, CAT, GP, and GR.

