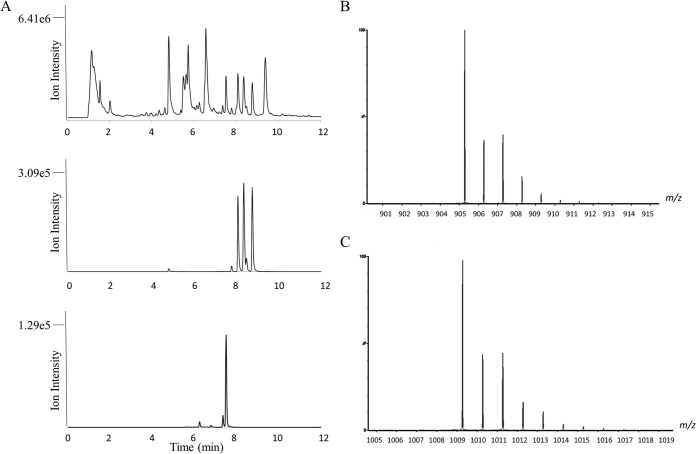
FIG 2.
High-resolution mass spectral analysis of M. jannaschii cell extract. (A) Total ion chromatogram of M. jannaschii cell extract (top); extracted ion chromatogram of M+ of 905.286 for coenzyme F430 showing isomers eluting at 7.79, 8.08, 8.35, 8.46, and 8.76 min (middle); extracted ion chromatogram of M+ of 1009.287 for F430-3 (bottom). The peaks at 6.26, 7.37, and 7.52 min represent the different isomers of F430-3. (B) Molecular ion isotope peaks for F430. (C) Molecular ion isotope peaks for F430-3.

