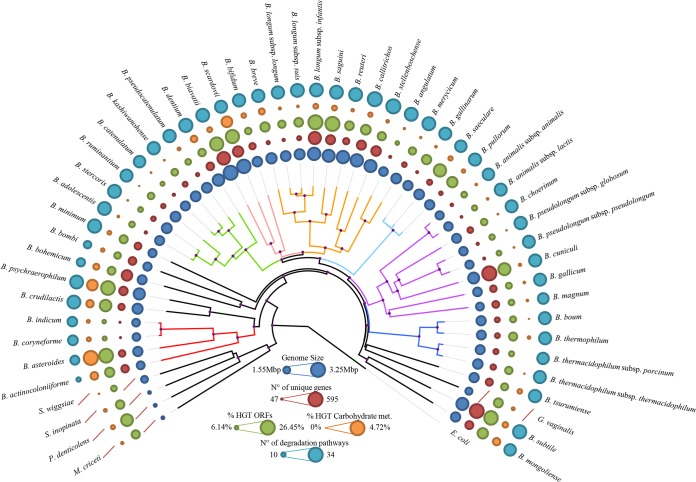
FIG 2.
Phylogenomic overview of the family Bifidobacteriaceae. A supertree based on the alignment of 404 core COGs (with a single representative identified for each genome of members of the family Bifidobacteriaceae) was constructed in order to obtain a robust phylogenetic reconstruction. Phylogenetic clusters are highlighted with similarly colored branches, and nodes with bootstrap values higher than 70% are marked with a purple dot. The phylogenetic clusters close to the root of the tree may represent species that are most closely related to the ancestor of the Bifidobacterium genus. Circles surrounding the tree represent the approximate genome sizes (in blue), numbers of TUGs (in red), percentages of genes predicted to have undergone horizontal gene transfer (in green), and percentages of genes predicted to be subject to horizontal gene transfer and carbohydrate metabolism and transport (in orange). The outermost layer represents the numbers of the complete predicted degradation pathways. E. coli, Escherichia coli; met., metabolism.

