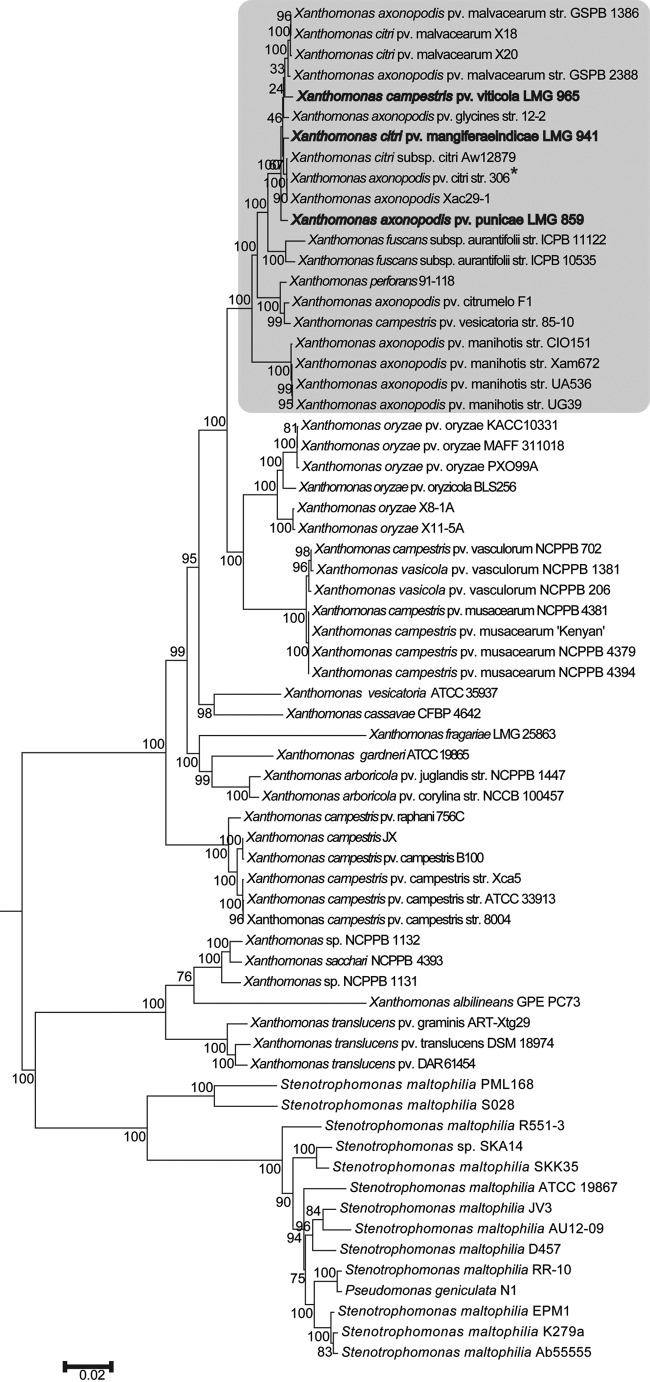
FIG 1.
Phylogenomic tree of Xanthomonas pathovars that infect diverse fruit crops. The scale bar shows the number of nucleotide substitutions per site. The bootstrap value with 500 replications is shown on nodes. The Xanthomonas axonopodis group is highlighted by a gray background. Strains under study are shown in bold, and the reference strain is marked with an asterisk.

