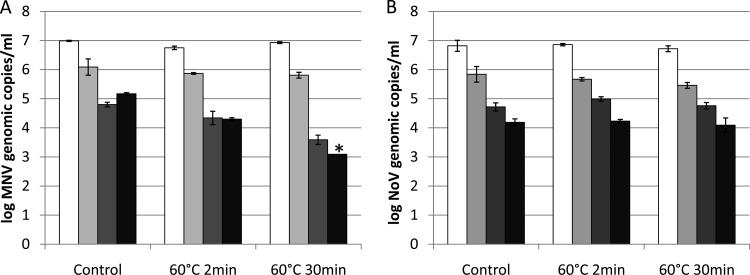
FIG 1.
Detection of MNV-1 (A) and human NoV GII.4 (B) genomic copies by RT-qPCR (white bars), long-range RT-qPCR (light gray bars), binding RT-qPCR (dark gray bars), and binding long-range RT-qPCR (black bars) after heat treatment. Each data point is an average of triplicates, and each error bar represents the data range. *, lower than the detection limit.

