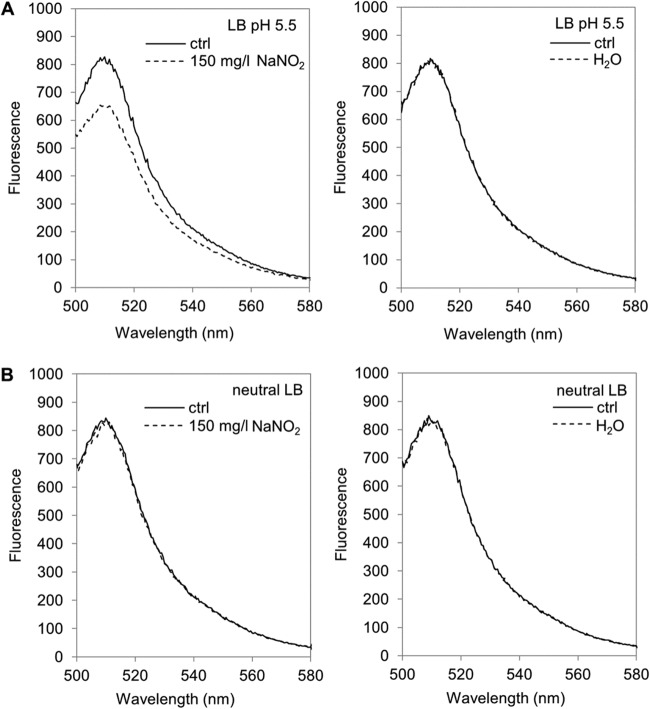
FIG 4.
Effect of acidified NaNO2 on the intracellular pH of S. Typhimurium. Shown are fluorescence emission spectra of the WT pEGFP strain in LB (pH 5.5) (A) or neutral LB (B) before (ctrl) and immediately after the addition of 150 mg/liter NaNO2 (left) or H2O (right). Representative spectra for three independent experiments are shown.

