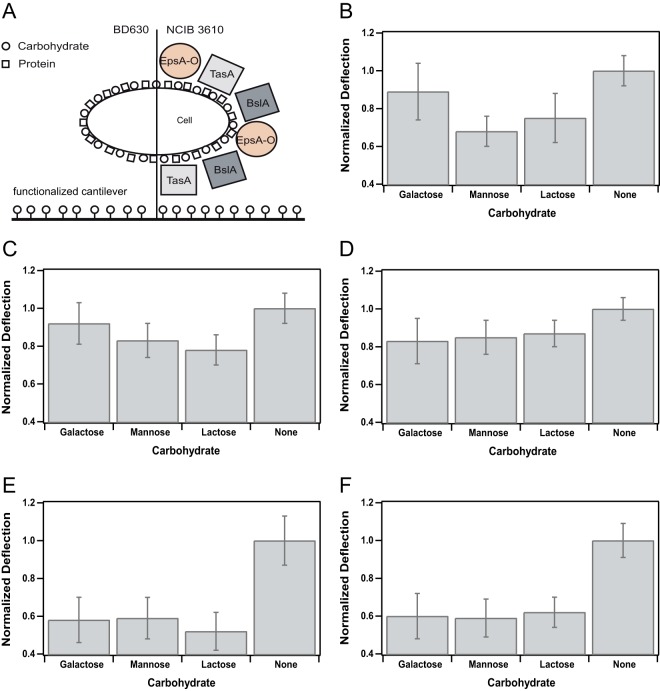
FIG 3.
Attachment profile for B. subtilis strain NCIB 3610 and several mutant strains unable to express distinct biofilm matrix components. (A) Pictogram for the two B. subtilis wild-type strains used in the present study. Carbohydrates are depicted as circles, and proteins are depicted as squares. On the left, the wild-type strain BD630 that is unable to form a proper biofilm matrix is shown; on the right, the wild-type NCIB 3610 is depicted with the main components of its biofilm matrix. Please note that size and distribution of carbohydrates and proteins are not up to scale. (B to F) Attachment profiles (see Table S2 in the supplemental material) of all B. subtilis wild-type and mutant strains used in this study (Table 1) normalized to the values obtained for the unfunctionalized, pure gold cantilever (None). The average maximal deflection in dependence of the functionalization with a particular carbohydrate is depicted. Error bars indicate the standard deviations of the averaged and normalized maximal deflections. Attachment profiles for NCIB 3610 (B), TasA mutant (C), BslA mutant (D), EpsA-O mutant (E), and the wild-type strain BD630 (F) are shown.

