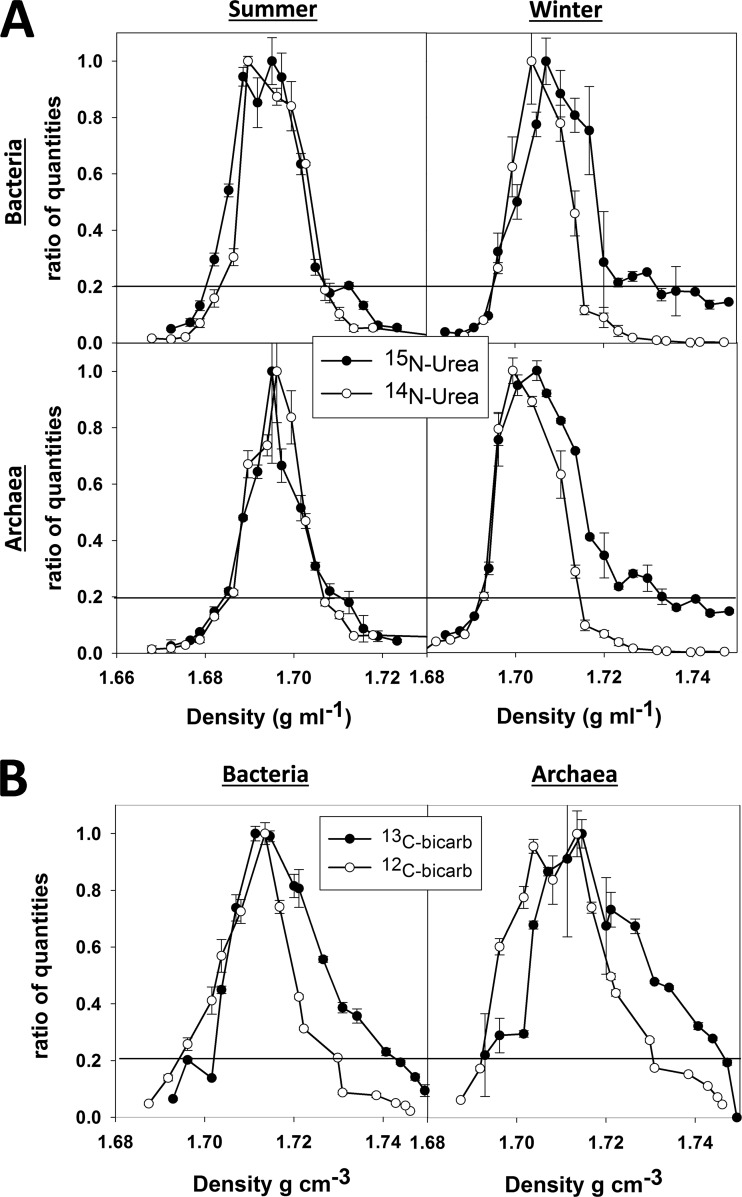
FIG 2.
Examples of qPCR analysis of SIP gradient fractions for bacterial and archaeal 16S rRNA gene copies of samples collected from the near-shore Arctic. The relative quantities detected in each fraction are shown as a function of density. All data were normalized to the highest quantities observed and are hence shown as ratios, where 1 equals the highest value observed. Error bars indicate one standard deviation calculated from three replicate qPCR measurements. The horizontal lines indicate the threshold above which quantities were integrated to calculate the average DNA density and the percentage of incorporation. (A) Comparison of winter and summer [14N]urea (○) and [15N]urea (●) treatments. (B) Dark carbon fixation SIP experiment showing [12C]bicarbonate (○) and [13C]bicarbonate (●) treatments for bacteria and archaea.

