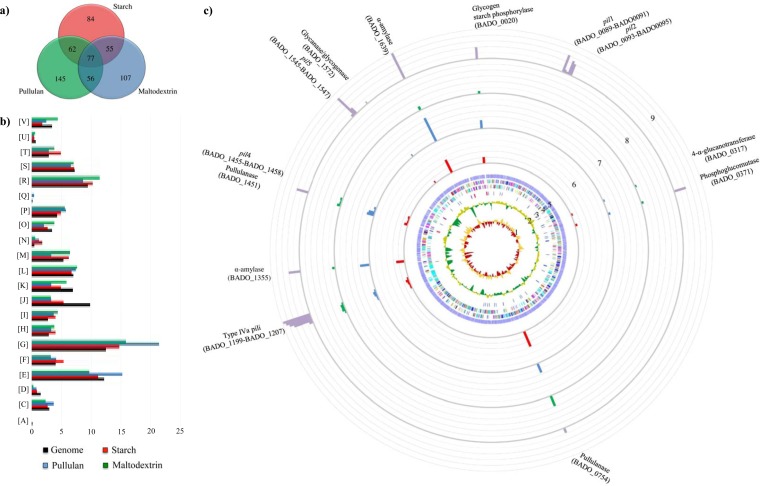
FIG 3.
Identification of B. adolescentis 22L differentially expressed genes by transcriptome analysis in response to growth on starch and starch-like carbohydrates. (a) Venn diagram showing the number of differently expressed genes during the different conditions: starch (shown in red), pullulan (represented in blue), and maltodextrin (depicted in green). The data displayed are based on RNA preparations from two independent culture experiments. (b) Functional annotation of the expressed genes of B. adolescentis 22L cultivated on starch and its derivatives according to their COG categories. Each COG family is identified by a one-letter abbreviation (National Center for Biotechnology Information database). For each category, the black bar represents the percentage of genes in that category as detected in the sequenced genome of 22L. The other bar shows the percentages of genes transcribed during growth of 22L on starch (shown in red), pullulan (represented in blue), and maltodextrin (depicted in green). The percentage was calculated as the percentage of transcribed genes belonging to the indicated COG category with respect to all transcribed genes. (c) Circular genome of B. adolescentis 22L mapped with the RNA-seq reads under in vitro and in vivo conditions by principal component analysis. From the inner circle, circle 1 shows the B. adolescentis 22L GC skew (G-C/G+C); circle 2 illustrates B. adolescentis 22L G+C% deviation; circle 3 indicates rRNAs (depicted in red) and tRNAs (depicted in blue); circle 4 shows coding regions by strand, with the color corresponding to the COG functional assignment; circle 5 denotes the ORF distribution; circles 6, 7, and 8 show the transcription level of genes encoding the different components of the starch degradation V pathway (52), when 22L cells were cultivated on starch, pullulan, and maltodextrin, respectively, and using 22L growth on glucose as a reference condition. Finally, circle 9 displays the expression of a starch metabolism-related gene upon colonization of mice using qRT-PCR. The data shown represent mean qRT-PCR values achieved for the five animals used.

