
FIG 2.
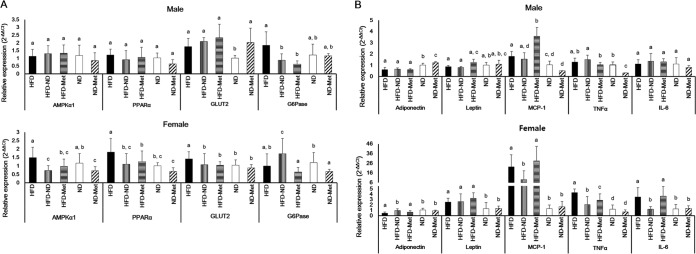
Metabolic and inflammatory biomarkers in the liver and fat pads. Relative levels of mRNA for metabolic and inflammatory biomarkers were analyzed using qPCR. (A) Expression in the livers of male and female mice; (B) expression in the epididymal fat pads of male mice and parametrial fat pads of female mice. The 2−ΔΔCT relative quantification method, described in Materials and Methods, was used for analysis of the level of biomarker expression compared to the level of GAPDH expression as an internal control. Different superscript letters indicate significant differences (P < 0.05) according to Duncan's post hoc test.