
FIG 3.
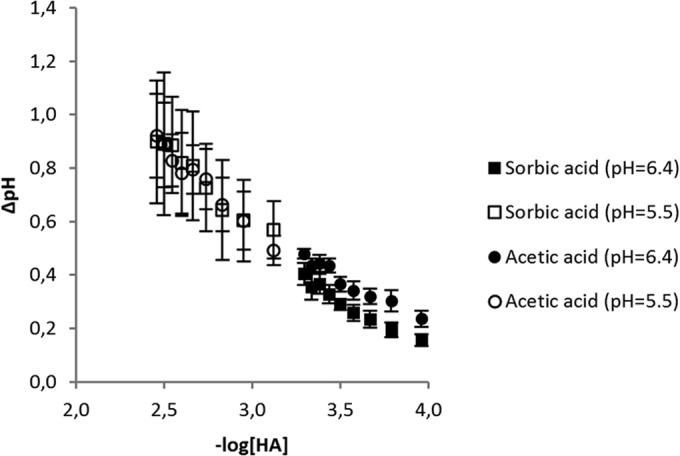
Amplitude of acidification by addition of sorbic or acetic acid. A linear trend can be observed between ΔpH and −log[HA] ([HA] is in M). Data from experiments at extracellular pHs of 5.5 and 6.4 are combined. Error bars indicate standard deviations.