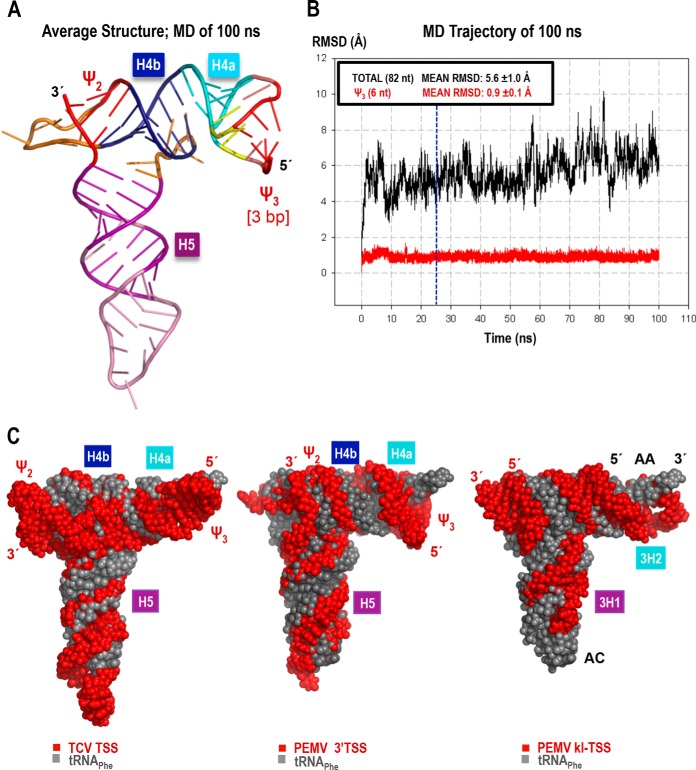
FIG 5.
3-D model and molecular dynamics simulation of the PEMV 3′TSS. The model with a 3-bp ψ3 is shown (see the text for details). (A) Energy-minimized average structure based on the 100-ns-long MD simulation. (B) The all-atom root mean square deviation (RMSD; 82 nt; 2,625 atoms), measured relative to the first structure of the MD simulation, is 5.6 Å (black). RMSD values plotted in red were calculated for all atoms of the 6 nt involved in ψ3 (3 bp long in this model, 191 atoms). The blue vertical line at the 25-ns point in the MD indicates when restraints on the first three base pairs were released (see the text for details). The low mean RMSD and standard deviation (0.9 ± 0.1 Å) of ψ3 illustrates the stability of the base pairs after the restraints were lifted. (C) Comparison of the 3-D structure models of the TCV TSS (left), PEMV 3′TSS (center), and PEMV kl-TSS (13) (right), all shown in red, aligned with the tRNAPhe structure (PDB 1EHZ) (gray). The TSS and kl-TSS 5′ and 3′ positions are labeled in red, while the tRNA's 5′ and 3′ positions, the anticodon loop (AC), and the acceptor stem (AA) are labeled in black over the most exposed tRNA (right).

