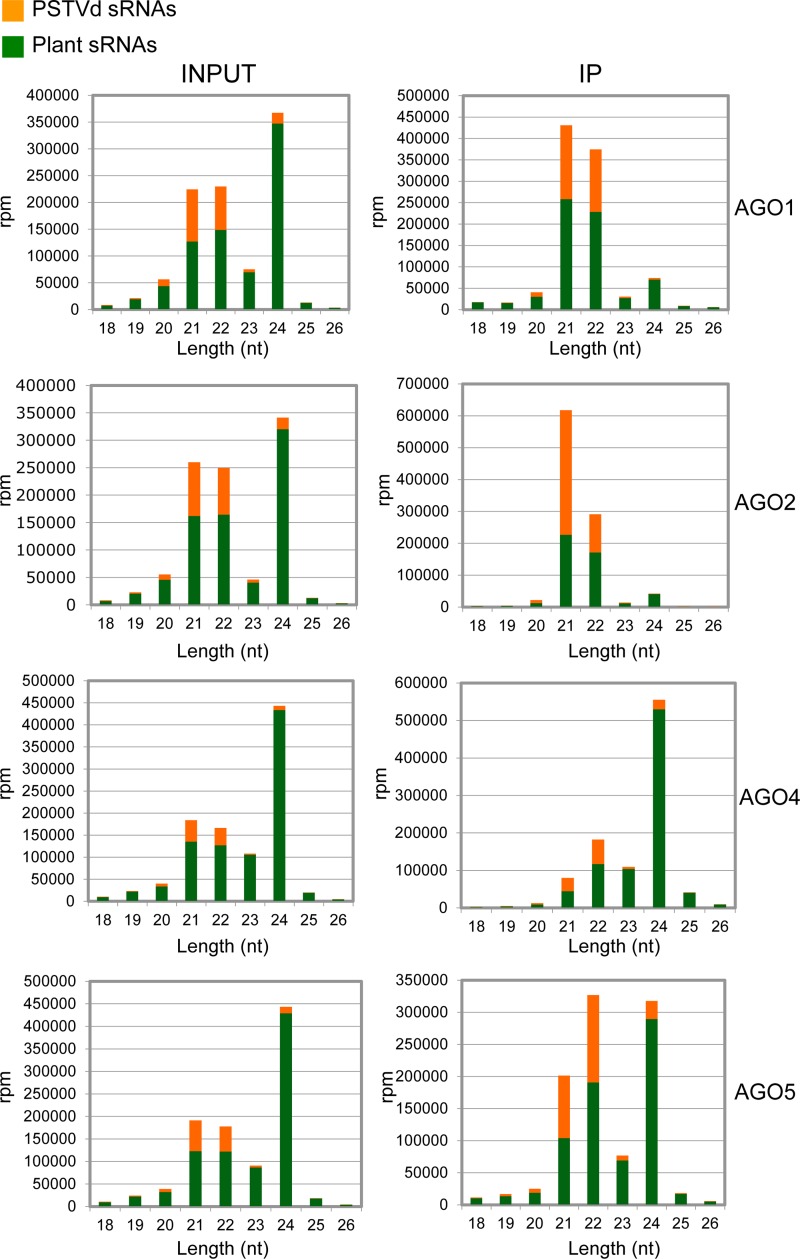
FIG 3.
Size distribution of PSTVd and plant sRNAs in total RNAs (INPUT) and immunoprecipitates (IP) from halos of PSTVd-infected N. benthamiana agroinfiltrated with cultures of A. tumefaciens with binary plasmids for expressing HA-tagged versions of AGO1, AGO2, AGO4, and AGO5 from A. thaliana. The histograms compare the distributions of 18- to 26-nt total sRNA reads. The IP fractions were generated with an anti-HA monoclonal antibody. Note that the scales are not identical in the different histograms and that the fraction of PSTVd-sRNAs could be higher considering that the viroid may not invade all cells.

