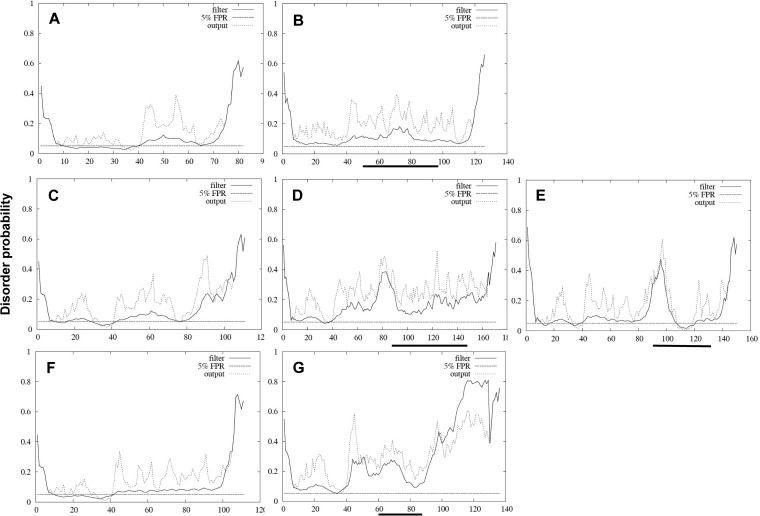
FIG 4.
Disordered-profile plots of the PPR with and without inserted sequences. (A) PPR sequence of TLS-20 without the insertion. (B) PPR of TLS-20 with the insertion. (C to E) PPR sequence of TLS-26 without inserted TAT sequence (C), with TAT (D), and with PPR insertion (E). (F and G) PPR sequence of TLS-09 without the inserted ITI sequence (F) and with the ITI insertion (G). Solid lines indicate the filtered disorder probabilities (FDP). Dashed lines indicate the raw disorder probabilities. The horizontal dashed line indicates the prediction threshold at 5% FPR. The horizontal solid bold line indicates the location of the inserted sequence. FDP > 30% was considered to represent a potential disordered region.

