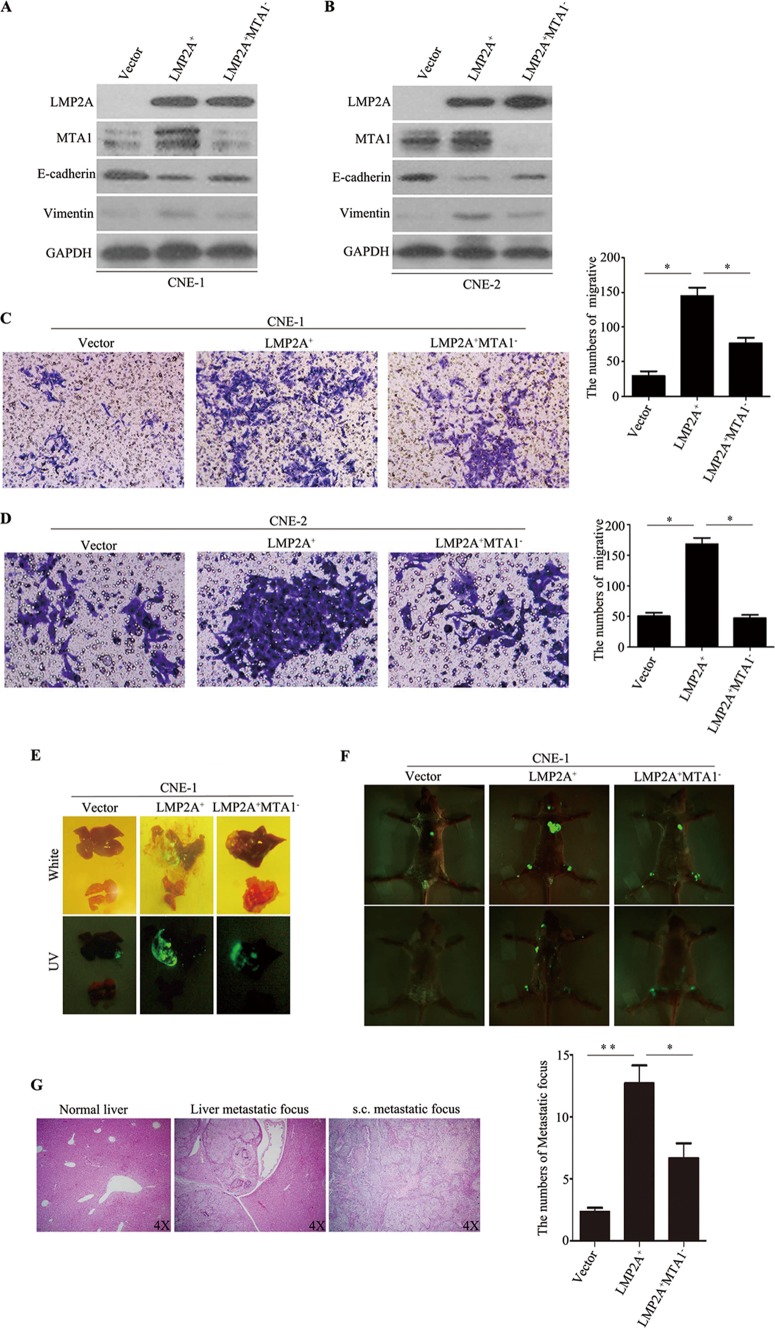
FIG 5.
LMP2A mediates EMT, migration, and invasion of NPC cells partly by activating MTA1 expression. (A and B) Western blot assay showing that LMP2A activated MTA1 expression in both CNE-1-LMP2A and CNE-2-LMP2A cells, decreased levels of an epithelial marker (E-cadherin), and increased levels of mesenchymal markers (vimentin) in CNE-1-LMP2A+MTA1− cells compared to CNE-1-LMP2A cells and CNE-2 cells. The blots are representative of two independent experiments. The quantification of the Western blot signals was analyzed (data not shown). (C and D) The silencing of MTA1 decreased the invasive capacity of CNE-1-LMP2A and CNE-2-LMP2A cells. The number of invading cells in the siMTA1 and scramble groups is shown on the right (n = 2 per condition). All data represent means ± SEM.*, P < 0.05 by independent Student's t test. (E) Representative metastatic nodules formed in the liver of nude mice 4 weeks after liver injection of cells (four mice per group). (F) The expression of LMP2A promoted CNE-1 cell invasion and metastasis, and the silencing of MTA1 decreased CNE-1-LMP2A cell invasion and metastasis in nude mice. Upper images, representative metastatic nodules (green spots) in nude mice; lower images, the number of metastatic nodules formed in nude mice 3 weeks after cell injection (4 mice per group). The error bars indicate means ± SEM. *, P < 0.05; **, P < 0.01 by independent Student's t test. (G) Examples of HE staining in subcutaneous (s.c.) and liver nodule samples originating from CNE-1-vector cell- and CNE-1-LMP2A cell-injected mice.

