
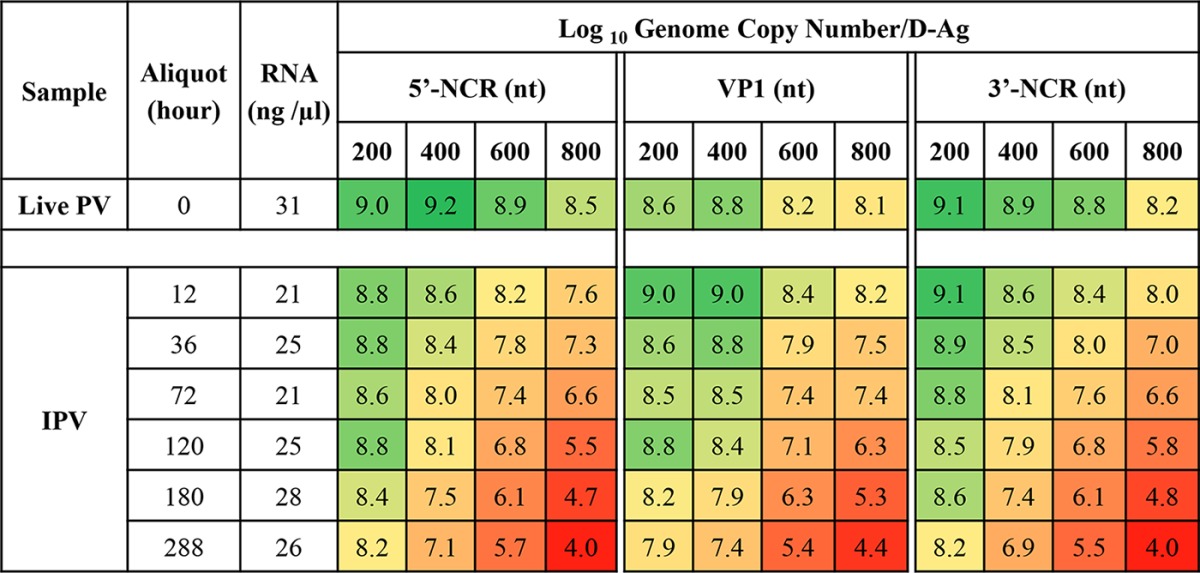
TABLE 3.
Quantification of viral RNA in PV samples by real-time RT-PCRa
a
The location in the genome and approximate size in nt of the amplified DNA is indicated. Values are colored from high (green) to medium (yellow) and low (red).
Official websites use .gov
A
.gov website belongs to an official
government organization in the United States.
Secure .gov websites use HTTPS
A lock (
) or https:// means you've safely
connected to the .gov website. Share sensitive
information only on official, secure websites.
Quantification of viral RNA in PV samples by real-time RT-PCRa
The location in the genome and approximate size in nt of the amplified DNA is indicated. Values are colored from high (green) to medium (yellow) and low (red).