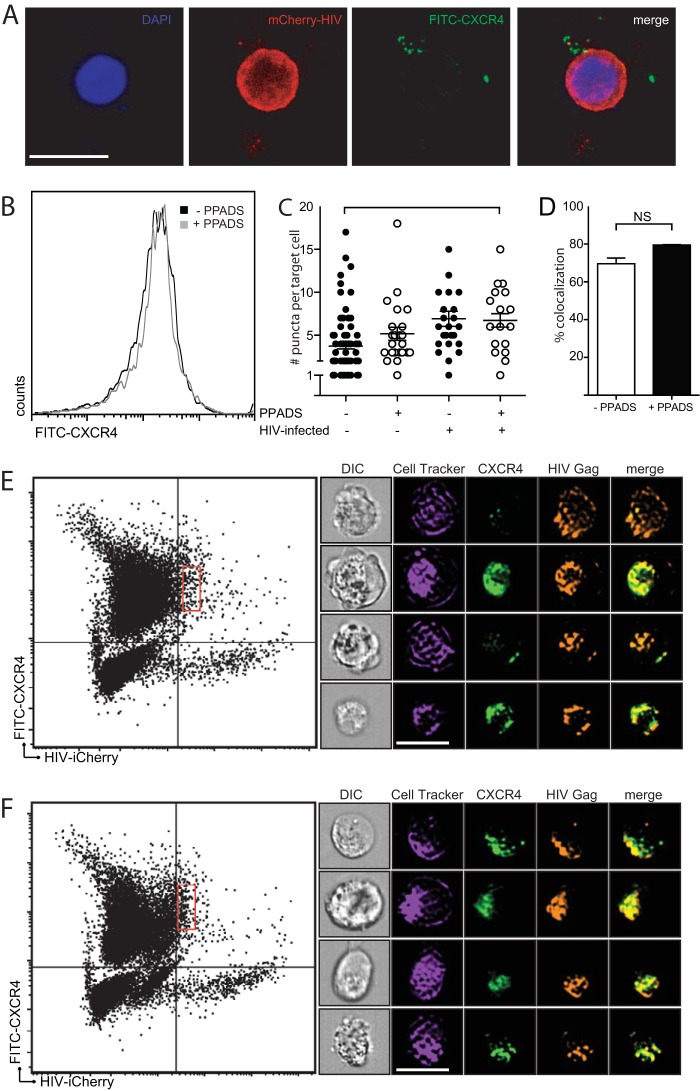
FIG 4.
Colocalization of CXCR4 with HIV-1 Gag in infected target cells. (A) Confocal microscopy images demonstrate an HIV-1 Gag-iCherry-infected Jurkat cell attached to three primary CD4 T cells. CXCR4 (green) is shown associated with Gag-iCherry (red). Bar, 10 μm. (B) PPADS does not affect CXCR4 staining of MT4 target cells, as determined by flow cytometric analysis of target cells labeled with anti-CXCR4. (C) Quantification of CXCR4 puncta on the basis of confocal microscopy demonstrates no difference in the number of CXCR4 puncta in the presence or absence of PPADS (results are the means ± SEMs of three independent experiments; P > 0.5, t test). (D) Amnis flow cytometry imaging was performed on infected cells, and a colocalization percentage was calculated on the basis of the proportion of HIV-positive target cells positive for CXCR4 in the presence or absence of 100 μm PPADS (results are the means ± SEMs of three independent experiments; P = 0.8, t test; NS, nonsignificant). (E, F) Amnis flow cytometry imaging illustrating gating of infected target cells. The x axis is Gag-iCherry (infected) cells, and the y axis is eFluor 450 (positive targets). The red rectangular gates in the right upper quadrants indicate HIV Gag-iCherry-positive target cells in untreated cocultures (E) or in cocultures treated with 100 μM PPADS (F). Representative images of colocalization of CXCR4 with HIV-1 Gag-iCherry on infected target cells without inhibitor treatment (E, right) or treatment with 100 μM PPADS (F, right). Bar, 10 µm.

