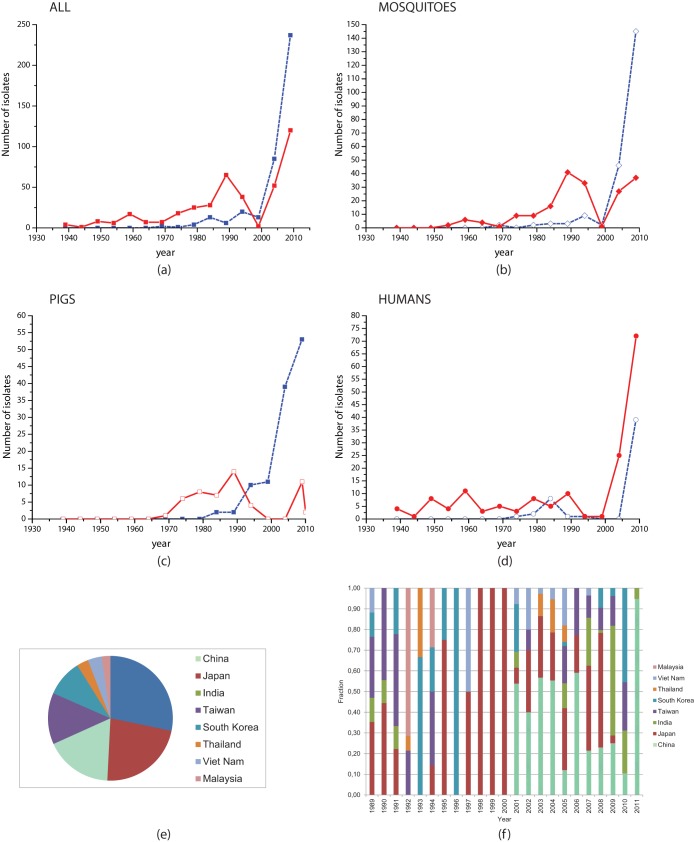
FIG 3.
Change in GI versus GIII host shift over time. Data represent variations over time in the number of collected JEV isolates for GI and GIII for all samples and for sample subsets. The red solid line represents GIII, and the blue dashed line represents GI. (a) Variations for all isolates, highlighting how GIII was displaced by GI as the dominant genotype in the middle of the 1990s. (b and c) Variations over time for mosquitoes and pigs, respectively, demonstrating similar displacement patterns. (d) Variations over time for human isolates. Despite GIII being displaced as the dominant genotype, the majority of human cases remain associated with GIII. (e and f) Geographical composition of samples collected over the time period (1990 to 2011) during which genotype replacement appears to have occurred. Panel e represents the sum over the entire period; panel f shows the variation by year. There is no region in which samples appear to have been preferentially sampled, and many regions have been continually represented over the time course.

