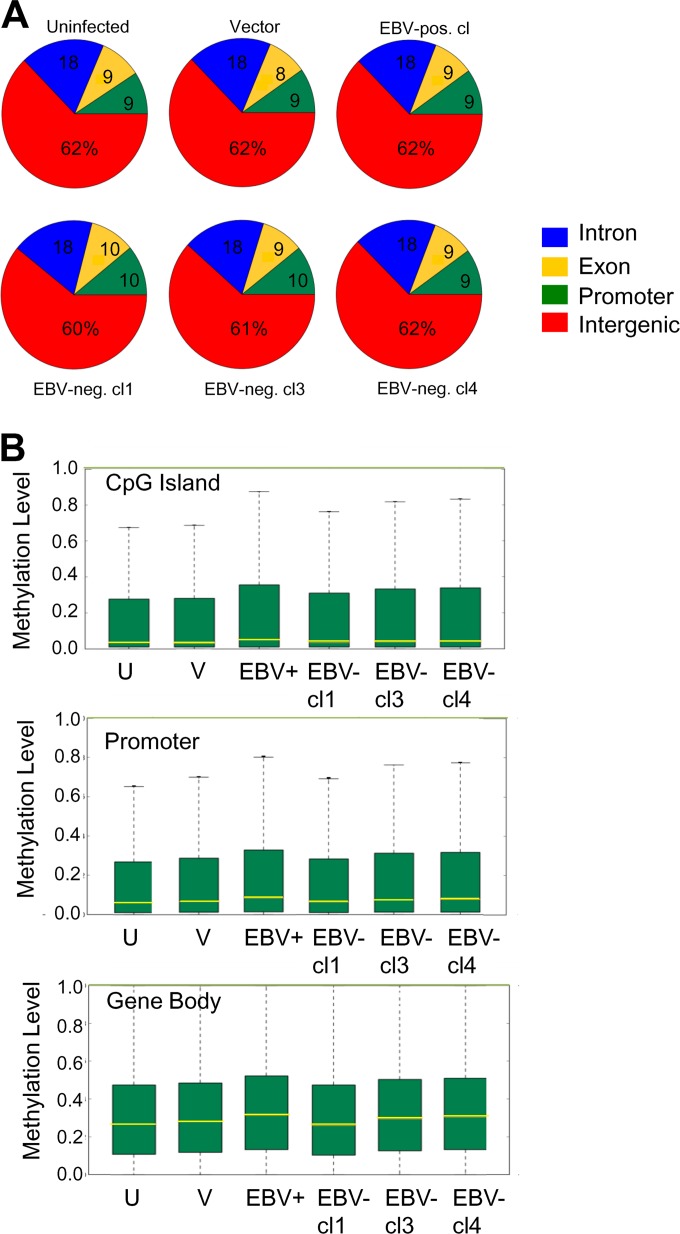
FIG 3.
Methylome analysis of NOK by RRBS. (A) Distribution of mapped CpG residues in NOK. (B) Box-and-whisker plots comparing the distribution of methylated CpG residues between uninfected (U) cells, a vector control (V), an EBV-positive clone (EBV+), and three transiently infected EBV-negative clones (EBV-cl1, -cl3, and -cl4) at CpG islands, promoters, and within gene bodies. The yellow line across the bar represents the median level of methylation, the top whisker represents the maximum level of methylation, and the bottom whisker, which goes to 0, represents the minimum level of methylation.

