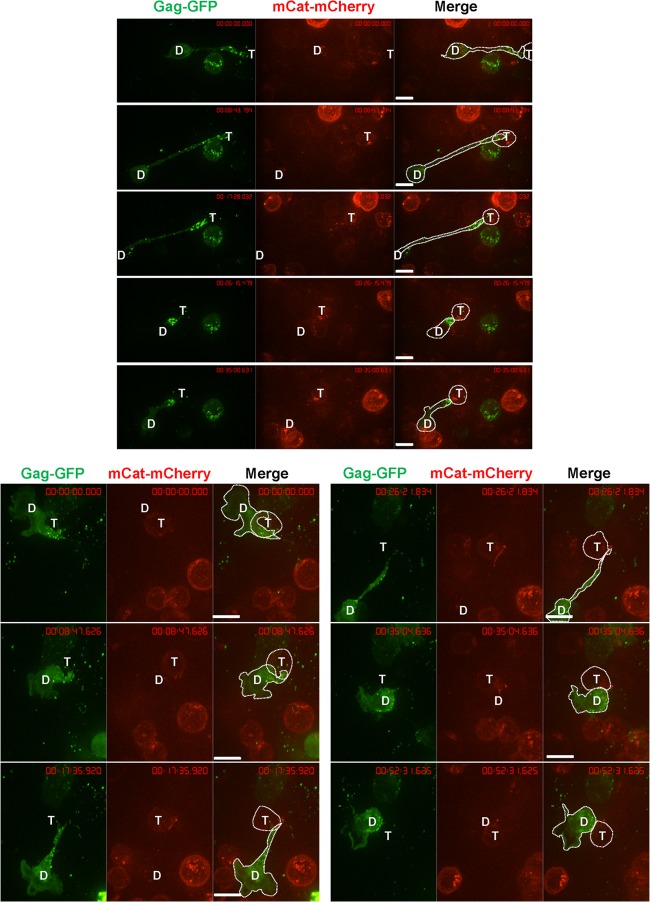
FIG 11.
Examples of transitions between filopodia and uropod-mediated virological synapses between primary B cells and T cells. Samples were prepared as described in the legend to Fig. 10. “D” marks the donor cell and “T” marks the target cell. Scale bars, 10 μm.

