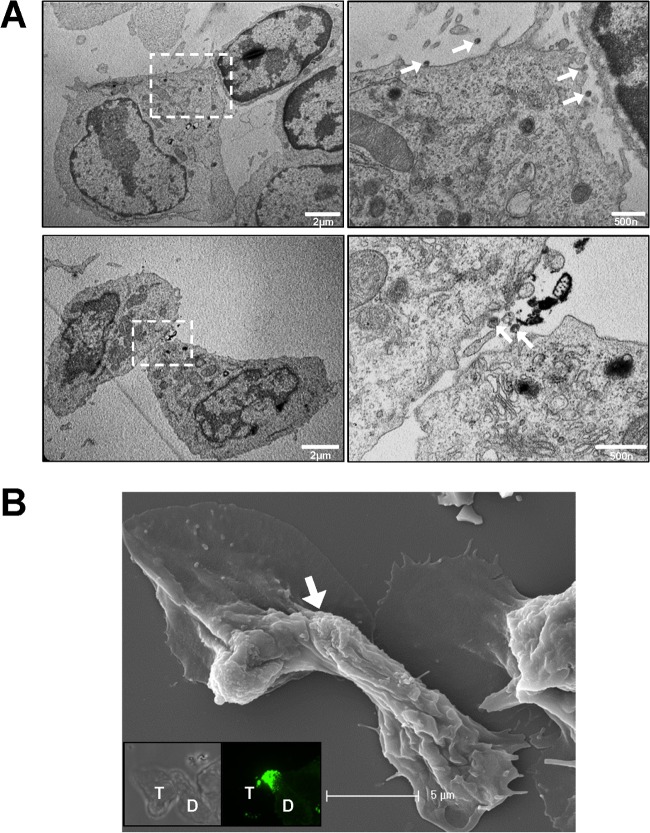
FIG 12.
Electron micrographs of uropod-mediated virological synapses between primary B cells. (A and B) Samples were prepared as for Fig. 7 and 8 and examined by TEM (A) and correlative SEM (B). The images to the right in panel A are magnifications of indicated regions. Arrows in panel A point to positions of virions. Insets in panel B are the bright-field and fluorescence images taken by confocal microscopy. “D” marks the donor cell and “T” marks the target cell. The arrow in panel B indicates the position of the uropod-mediated contact.

