FIG 1.
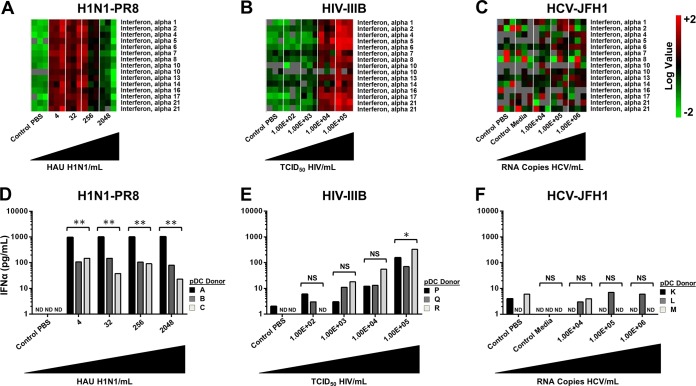
Differential regulation of IFN-α in pDCs exposed to H1N1 influenza virus, HIV, and HCV JFH-1. pDCs from three separate donors were exposed to various concentrations of virus. (A) Heat maps generated with microarray data of the IFN-α genes from pDCs stimulated with PBS (control) or influenza virus A/PR/8/34 (H1N1; Charles River Laboratories) at 4, 32, 256, or 2,048 HAU/ml. (B) Heat maps generated with microarray data of the IFN-α genes from pDCs stimulated with PBS (control) or HIV-1 IIIB (Advanced Biotechnologies) at 1.00 ×10², 1.00 ×10³, 1.00 × 10⁴, or 1.00 ×10⁵ 50% tissue culture infective doses (TCID50)/ml. (C) Heat maps generated with microarray data of the IFN-α genes from pDCs stimulated with PBS (control 1), conditioned medium (control 2), or HCV at 1.00 ×10⁴, 1.00 ×10⁵, or 1.00 × 10⁶ RNA copies/ml. (D) Quantification of IFN-α protein production by ELISA in pDCs stimulated with PBS (control) or influenza virus A/PR/8/34 (H1N1; Charles River Laboratories) at 4, 32, 256, or 2,048 HAU/ml. (E) Quantification of IFN-α protein production by ELISA in pDCs stimulated with PBS (control) or HIV-1 IIIB (Advanced Biotechnologies) at 1.00 ×10², 1.00 ×10³, 1.00 × 10⁴, or 1.00 ×10⁵ TCID50/ml. (F) Quantification of IFN-α protein production by ELISA in pDCs stimulated with PBS (control 1), conditioned medium (control 2), or HCV at 1.00 ×10⁴, 1.00 ×10⁵, or 1.00 × 10⁶ RNA copies/ml. *, P < 0.05; **, P < 0.01 (determined by ratio paired t test compared with the corresponding control). NS, not significant. ND, not detectable.

